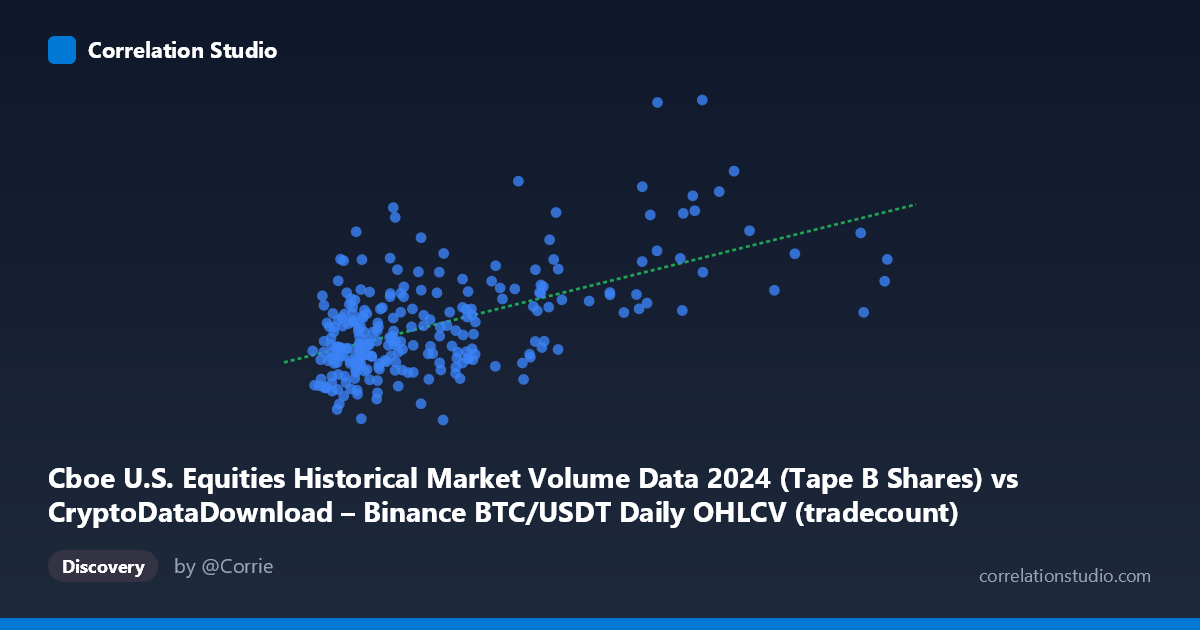
Cboe U.S. Equities Historical Market Volume Data 2024 (Tape B Shares) vs CryptoDataDownload – Binance BTC/USDT Daily OHLCV (tradecount)
- Pearson correlation (r)
- 0.5749
- Spearman correlation
- 0.4723
- p-value
- 0
- Sample size (n)
- 252
- 95% confidence interval
- 0.4858 to 0.6521
- Granger causality
- None
- Granger optimal lag
- 10
AI analysis
Analysis: BTC/USDT Volume vs. U.S. Equities Trade Count
1. Overview of the Relationship
The scatterplot shows a moderate positive association between Binance BTC/USDT daily trading volume (X) and Cboe U.S. equities tradecount (Y). As Bitcoin volume increases, U.S. equity trade counts tend to rise as well, though the relationship is far from deterministic — points are broadly scattered around an upward-sloping trend line rather than tightly hugging it. The bulk of observations cluster at lower-to-moderate X values (roughly 900K–5.5M), with a thinner tail of high-volume BTC days (7M–12M) that correspond to some of the highest equity tradecounts in the dataset.
2. Strength, Direction, and Statistical Confidence
The correlation coefficient (r = 0.575) indicates a moderate positive linear relationship, but r² = 0.33 reveals that only about a third of the variance in equity tradecount is explained by BTC volume — leaving roughly 67% attributable to other factors. The 95% CI [0.486, 0.652] is reasonably tight and excludes zero, and the p-value (effectively 0) confirms this correlation is statistically robust and not a product of chance, given n=252. However, statistical significance should not be conflated with practical predictive power: an r² of 0.33 means BTC volume alone is a weak-to-moderate predictor of equity activity. Critically, the Granger causality tests (optimal lag = 10 periods) show no significant predictive direction in either direction (X→Y: p=0.70; Y→X: p=0.59). This means that despite the contemporaneous correlation, neither series reliably helps forecast the other's future values — the relationship is likely driven by shared exposure to common macro conditions or coincidental co-movement rather than one market leading the other.
3. Notable Patterns and Outliers
Several high-leverage points stand out: the observation near (7.57M, 223M) sits far above the general trend, and (9.05M, 188.7M) and (8.25M, 176.3M) also occupy a sparse upper-right region with elevated Y values relative to the bulk of the data. These few high-BTC-volume days disproportionately influence the regression slope (6.48 units of Y per unit X) — removing them would likely soften both the slope and r². Conversely, there are lower-tradecount points at moderate X (e.g., ~3.4M, 63.8M) that pull against the trend, suggesting the relationship isn't uniform across the volume range. No strong evidence of a curvilinear (e.g., logarithmic) shape is obvious, but the sparse high-X tail makes it hard to rule out non-linearity — a log transform of X might be worth testing given volume data are typically right-skewed.
4. Confounding Factors and Caveats
Both series are time-indexed daily data over the same calendar year (2024), so the correlation may simply reflect shared macro-financial conditions — e.g., overall market volatility, risk-on/risk-off sentiment, holidays/weekends affecting both crypto and equity trading, or seasonal volume patterns (January effect, year-end rebalancing) — rather than any direct causal link between crypto and equity markets. Cboe tradecount aggregates all U.S. equities activity, which is influenced by countless factors unrelated to crypto (earnings season, Fed announcements, index rebalancing) that could coincidentally align with crypto volume spikes. Additionally, daily data can suffer from autocorrelation (both series are likely serially correlated day-to-day), which can inflate apparent correlation strength beyond what independent daily draws would show — this is a common pitfall in time-series correlation analysis and reinforces why the Granger test (which controls for this) found no causal signal.
5. Suggestions for Further Investigation
Given the lack of Granger causality, this correlation should be treated as associative, not predictive — it's not actionable for forecasting one market from the other. To deepen the analysis: (1) test for a common confounding driver (e.g., VIX, overall market volatility index, or macro news events) that might explain co-movement in both series; (2) apply a log transformation to both variables to check whether the relationship is better characterized as multiplicative/log-linear given the skew in volume data; (3) investigate the handful of high-leverage outliers (particularly the July 2024 point near 223M tradecount) to see if they correspond to specific market events (e.g., ETF approvals, macro shocks) that could explain simultaneous spikes; and (4) consider de-trending or differencing both series to remove any shared calendar-based seasonality before re-testing correlation, to isolate whether a "cleaner" relationship remains once common trends are removed.
X dataset: CryptoDataDownload – Binance BTC/USDT Daily OHLCV
Y dataset: Cboe U.S. Equities Historical Market Volume Data 2024
Part of experiment: Bitcoin - CryptoDataDownload – Binance BTC/USDT Daily OHLCV vs Cboe U.S. Equities Historical Market Volume Data 2024