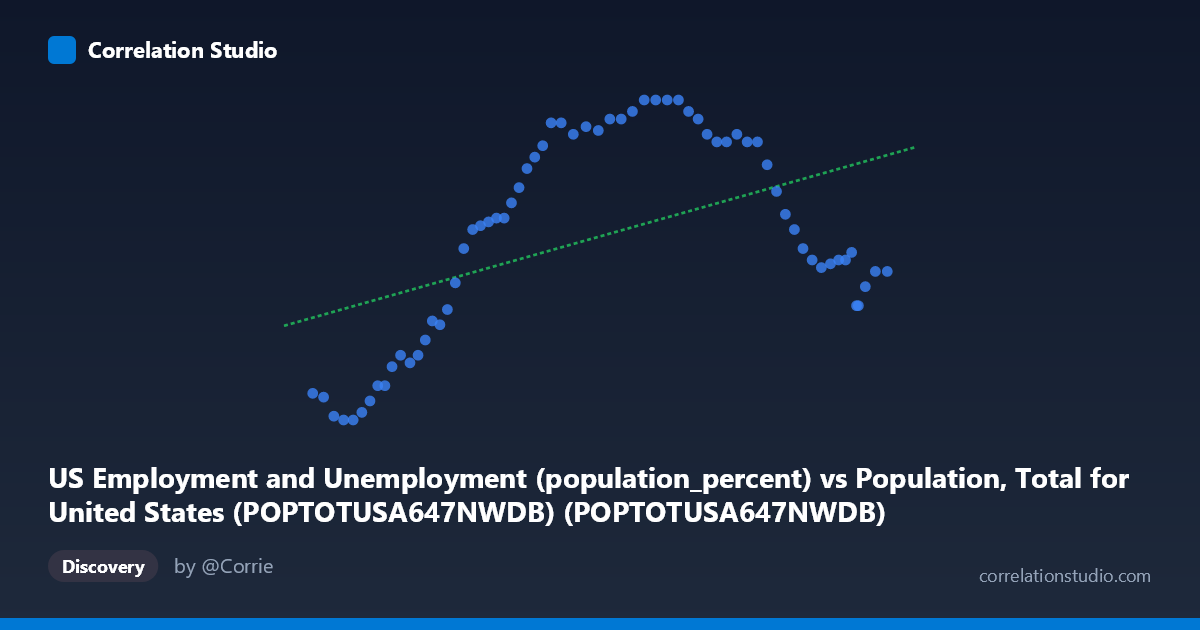
US Employment and Unemployment (population_percent) vs Population, Total for United States (POPTOTUSA647NWDB) (POPTOTUSA647NWDB)
- Pearson correlation (r)
- 0.4873
- Spearman correlation
- 0.4425
- p-value
- 0.000038
- Sample size (n)
- 65
- 95% confidence interval
- 0.2763 to 0.6535
- Granger causality
- None
- Granger optimal lag
- 1
AI analysis
Scatterplot Analysis: US Population vs. Employment Rate
Overview of the Relationship
The scatterplot reveals a moderately positive association between total US population (X-axis) and the employment-population percentage (Y-axis) over the period 1960–2024. As population has grown from roughly 180 million to 340 million, the employment rate generally trended upward from the high 50s to the upper 60s percentage-wise. However, the relationship is clearly non-linear and non-monotonic, with a pronounced arch or inverted-U shape visible in the data: employment rates rise as population grows through the mid-range (~240M–290M), then decline back toward lower values at the highest population figures (~310M–340M). This pattern immediately signals that a simple linear model is an incomplete descriptor of the underlying dynamics.
Correlation Strength, Direction, and Statistical Significance
The Pearson correlation of r = 0.487 indicates a moderate positive linear association, but the coefficient of determination r² = 0.2375 tells the more sobering story — only 23.7% of the variance in the employment rate is explained by population size alone. The remaining ~76% is attributable to other factors entirely. The 95% confidence interval [0.276, 0.654] is reasonably wide, reflecting meaningful uncertainty in the true population-level correlation, though the p-value of 3.84×10⁻⁵ confirms this association is statistically significant and unlikely to be a chance finding given N = 65. Critically, the Granger causality tests show no significant temporal predictive direction in either direction (X→Y: p = 0.924; Y→X: p = 0.384). This means that population size does not help predict next year's employment rate, and vice versa — the correlation, while real, carries no demonstrated predictive or causal leverage at a one-year lag.
Notable Patterns, Clusters, and Non-Linear Features
Three distinct clusters are visually apparent. The first cluster (population ~180M–230M, employment ~58–64%) corresponds roughly to the 1960s–1980s, showing a rising trend as the Baby Boomer generation entered the workforce and female labor force participation expanded. The second cluster (population ~230M–290M, employment ~64–67%) represents a peak period in the 1980s–early 2000s, where employment rates reached their highest levels. The third cluster (population ~300M–340M, employment ~61–66%) marks the 2000s–2020s, where employment rates are notably more dispersed and generally lower despite continued population growth — likely capturing the impacts of the 2008 financial crisis and the COVID-19 pandemic. Several high-population points (320M) cluster tightly in the 62–63% range, acting as leverage points that pull the linear fit downward and contribute to the arch shape. No extreme univariate outliers are evident, but the overall non-linearity strongly suggests a linear model is misspecified.
Confounding Factors and Caveats
The most significant caveat is that population size is a weak and indirect proxy for labor market conditions. The employment-population ratio is driven by age structure (an aging population mechanically reduces the ratio even with strong job markets), business cycle dynamics, policy changes, demographic shifts in female participation, immigration patterns, and structural economic transformations — none of which are captured by a simple headcount. The arch pattern strongly suggests omitted variable bias: the post-2000 decline in employment rates despite growing population reflects retirements, disability increases, and cyclical shocks rather than any causal effect of population growth itself. Furthermore, using annual aggregate data suppresses within-year and regional variation. The Granger non-causality result reinforces that this correlation is likely a spurious co-movement of two variables that both evolve over time rather than a meaningful mechanistic relationship.
Actionable Insights and Further Investigation
Given the non-linear structure, a polynomial or piecewise regression would fit substantially better than the current linear model (r² = 0.24), and should be evaluated. More productively, researchers should decompose the analysis by decade or business cycle phase to understand whether the population–employment relationship differs systematically across eras. Controlling for age structure (working-age population share) would be a high-priority refinement, as it directly mediates the relationship. Incorporating GDP growth, Federal Reserve policy cycles, or labor force participation rates by demographic cohort as additional predictors would likely explain far more of the residual 76% variance. Finally, testing longer Granger causality lags (beyond 1 period) might reveal delayed demographic effects on employment that a one-year window misses entirely.
X dataset: Population, Total for United States (POPTOTUSA647NWDB)
Y dataset: US Employment and Unemployment
Part of experiment: Yearly - Population, Total for United States (POPTOTUSA647NWDB) vs US Employment and Unemployment