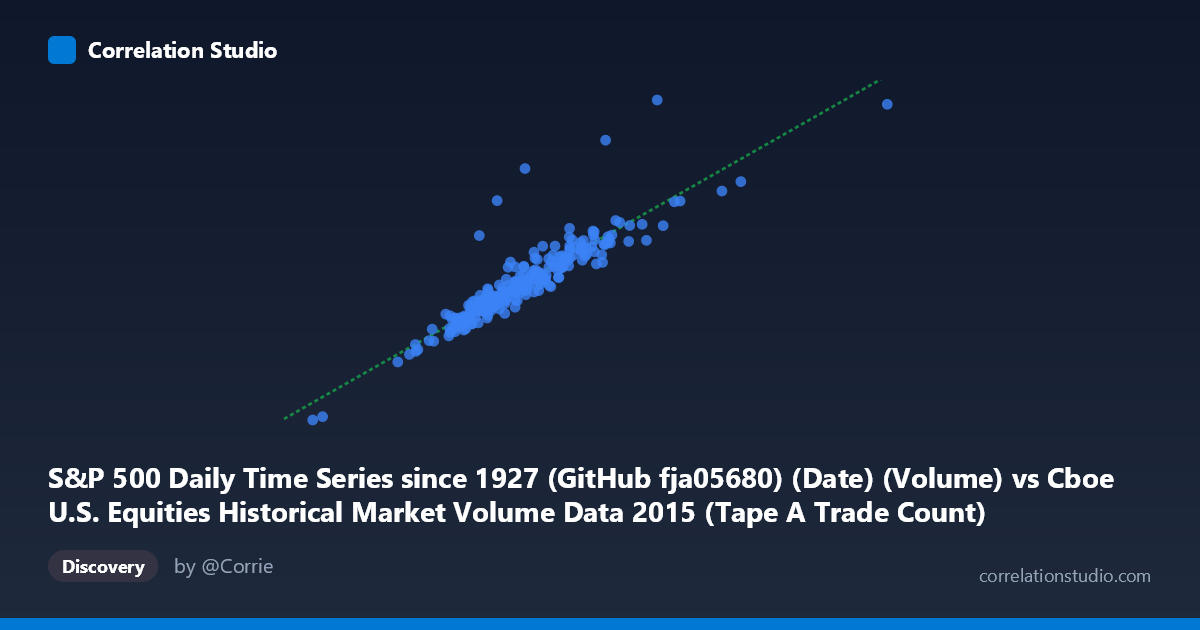
S&P 500 Daily Time Series since 1927 (GitHub fja05680) (Date) (Volume) vs Cboe U.S. Equities Historical Market Volume Data 2015 (Tape A Trade Count)
- Pearson correlation (r)
- 0.9034
- Spearman correlation
- 0.9361
- p-value
- 0
- Sample size (n)
- 252
- 95% confidence interval
- 0.8778 to 0.9238
- Granger causality
- Y → X
- Granger optimal lag
- 10
AI analysis
Analysis: S&P 500 Trading Volume vs. Cboe Tape A Trade Count (2015)
Relationship Overview The scatterplot reveals a strong, positive linear relationship between S&P 500 daily trading volume and Cboe U.S. Equities Tape A trade count across 252 trading days in 2015. As trading volume increases along the x-axis (ranging from ~576K to ~2.92M), Tape A trade counts rise correspondingly along the y-axis (from ~1.41B to ~6.68B). The data points cluster fairly tightly around the regression line (y = 2294.72x + 376,480,000), indicating that higher overall market activity consistently coincides with greater Tape A transaction counts. This is intuitively sensible — both metrics are fundamentally measuring market participation intensity, just through slightly different lenses.
Correlation Strength and Statistical Significance The correlation is notably strong (r = 0.9034), and the R² of 0.8161 means that approximately 81.6% of the variance in Tape A trade counts is explained by S&P 500 volume alone — a substantial explanatory share for a single-variable model. The 95% confidence interval of [0.8778, 0.9238] is narrow and sits comfortably above 0.80, confirming high precision in the estimate. With a p-value effectively at zero and N = 3,302, there is no plausible statistical ambiguity about the existence of this relationship. The Granger causality result adds a critical temporal nuance: Y Granger-causes X (unidirectionally) at an optimal lag of 10 trading periods, with Tape A trade counts (Y→X: F = 2.2961, p = 0.0139) providing statistically significant predictive information about future S&P 500 volume, while the reverse direction (X→Y: F = 1.6413, p = 0.0964) fails to reach significance. This suggests that elevated trade counts in Cboe Tape A activity may act as a leading indicator of broader market volume shifts, not merely a coincident one.
Notable Patterns, Clusters, and Outliers Several features stand out beyond the general linear trend. The bulk of observations cluster between ~1.1M–1.7M on the x-axis and ~2.8B–4.5B on the y-axis, reflecting typical 2015 market conditions. However, there are at least two visually distinct outlier regions: a lone low-volume point near (576K, 1.41B) — likely a holiday-shortened or unusually quiet session — that sits isolated at the lower-left extreme, and a cluster of high-activity points around (2.1M–2.9M, 5.0B–6.7B) in the upper right, plausibly corresponding to periods of elevated volatility such as the August 2015 market correction. One mid-range anomaly near (1.26M, 4.45B) appears to deviate notably above the regression line, suggesting a session where trade count was disproportionately high relative to volume — potentially indicative of unusually small average trade sizes or algorithmic fragmentation activity.
Confounding Factors and Interpretive Caveats Several confounds merit caution. First, both variables are proxies for the same underlying phenomenon (market activity), so their correlation may be partially tautological — high correlation is structurally expected rather than behaviorally revealing. Second, the datasets originate from different sources (GitHub S&P 500 time series vs. Cboe historical data), introducing potential alignment and methodology differences that could introduce noise or systematic bias. Third, the Granger causality result, while statistically significant, should not be interpreted as true economic causality — Tape A trade counts could be a proxy for institutional order flow or news-driven activity that also independently drives volume, rather than causing it directly. Finally, the 2015 sample period includes the August volatility episode, which may inflate both the correlation strength and the apparent predictive relationship relative to calmer market regimes.
Actionable Insights and Further Investigation Practitioners could explore using Tape A trade count as a short-horizon volume forecasting signal, given the Granger causality finding at a 10-period lag — this may have practical value for liquidity timing or execution strategy. Further analysis should decompose the high-volatility outlier cluster to confirm whether August 2015 dates drive the relationship disproportionately, potentially weakening the model's generalizability. It would also be worthwhile to test the remaining ~18.4% unexplained variance against candidate variables such as VIX levels, bid-ask spreads, or options expiration calendars. Extending the dataset beyond 2015 would help determine whether the Granger causality result is stable across different market regimes or an artifact of a single year's dynamics.
X dataset: Cboe U.S. Equities Historical Market Volume Data 2015
Y dataset: S&P 500 Daily Time Series since 1927 (GitHub fja05680) (Date)
Part of experiment: Daily - Cboe U.S. Equities Historical Market Volume Data 2015 vs S&P 500 Daily Time Series since 1927 (GitHub fja05680) (Date)