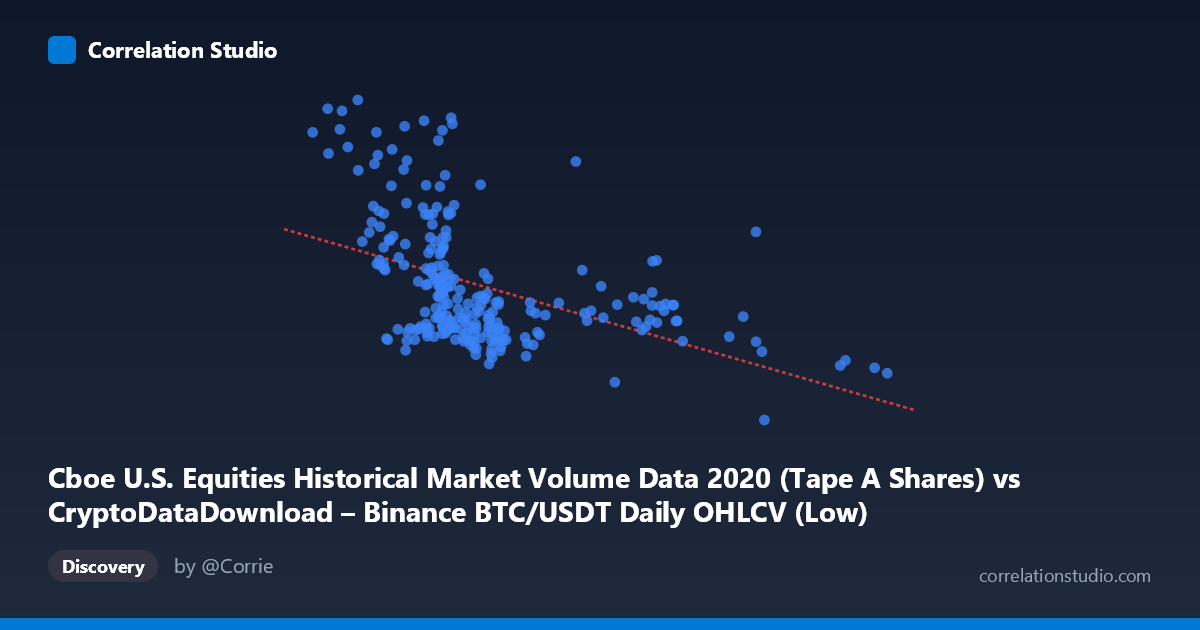
Cboe U.S. Equities Historical Market Volume Data 2020 (Tape A Shares) vs CryptoDataDownload – Binance BTC/USDT Daily OHLCV (Low)
- Pearson correlation (r)
- -0.4601
- Spearman correlation
- -0.5426
- p-value
- 0
- Sample size (n)
- 253
- 95% confidence interval
- -0.5521 to -0.3571
- Granger causality
- None
- Granger optimal lag
- 10
AI analysis
Analysis of the Relationship Between Cboe Equities Volume and BTC/USDT Low Price
1. Overview of the Visualization
The scatterplot shows a moderate negative relationship between U.S. equities market volume (X-axis) and Bitcoin's daily low price (Y-axis) across 253 paired trading days in 2020. As equities volume increases, Bitcoin's low price tends to decrease, though the relationship is far from deterministic — the data cloud is wide and diffuse rather than tightly hugging the regression line. Most X-values cluster between 7,000–12,000, with a secondary, sparser tail extending out to 27,850, suggesting the equities volume metric has a skewed distribution with occasional high-volume days.
2. Strength, Direction, and Statistical Confidence
The correlation coefficient (r = -0.460) indicates a moderate negative relationship, but r² = 0.212 tells the more important story: only about 21% of the variance in Bitcoin's low price is explained by equities volume. This leaves nearly 80% of Bitcoin price variation attributable to other factors entirely. The 95% CI [-0.552, -0.357] is reasonably tight and excludes zero, and the p-value (1.155E-14) confirms this correlation is highly statistically significant — it's very unlikely to be a artifact of chance given n=253. However, statistical significance ≠ practical strength; this is a real but modest association, not a reliable predictive relationship. Critically, the Granger causality tests show no significant predictive direction in either direction (X→Y: p=0.933; Y→X: p=0.663). This means neither variable's past values help forecast the other's future values — the correlation appears to be contemporaneous/coincidental rather than causal or lead-lag in nature, likely both responding to a shared external driver (e.g., broad 2020 market conditions).
3. Notable Patterns and Outliers
Several high-Y outliers stand out prominently: points like (8445, 535.6M), (9581, 540.0M), and (3782.13, 518.7M) sit far above the main cluster, corresponding to Bitcoin's lower-price days coinciding with unusually low equities volumes — likely reflecting the March 2020 COVID crash period when both BTC prices were low and market dynamics were unusual. The bulk of the data forms a dense cluster in the X∈[7000,12000], Y∈[200M,350M] region, while higher-X points (17,000–27,850) consistently show lower, more compressed Y-values (~200M–330M), suggesting a possible non-linear or threshold effect where the negative relationship weakens or flattens at high equities volumes. This hints the linear model may not fully capture the true shape of the relationship.
4. Confounding Factors and Caveats
This correlation is almost certainly confounded by time itself — both series evolved through 2020's distinct market regimes (COVID crash, recovery, and Bitcoin's year-end rally). A shared temporal trend (e.g., declining equities volume as markets stabilized post-March, coinciding with rising BTC prices later in the year) could produce this negative correlation without any direct economic linkage. Additionally, using BTC's "Low" rather than "Close" price is somewhat arbitrary and may introduce volatility-related noise. The mismatched dataset origins (crypto exchange data vs. traditional equities market data) also raises concerns about whether this pairing has genuine economic rationale or is a spurious statistical artifact from two unrelated time series with autocorrelated trends.
5. Recommendations for Further Investigation
Given the lack of Granger causality, this relationship should not be used for predictive trading models in either direction. Instead, analysts should: (a) detrend or difference both series to test if the correlation persists after removing shared temporal drift — this would help distinguish genuine linkage from spurious trend-driven correlation; (b) segment the analysis by 2020 sub-periods (pre-COVID, crash, recovery) to see if the relationship is driven entirely by the March anomaly; (c) explore non-linear models (e.g., piecewise or log transforms) given the apparent flattening at high X-values; and (d) investigate plausible confounders like overall market volatility indices (VIX) or macro liquidity conditions that could simultaneously influence both equities volume and crypto prices during this turbulent year.
X dataset: CryptoDataDownload – Binance BTC/USDT Daily OHLCV
Y dataset: Cboe U.S. Equities Historical Market Volume Data 2020
Part of experiment: Bitcoin - CryptoDataDownload – Binance BTC/USDT Daily OHLCV vs Cboe U.S. Equities Historical Market Volume Data 2020