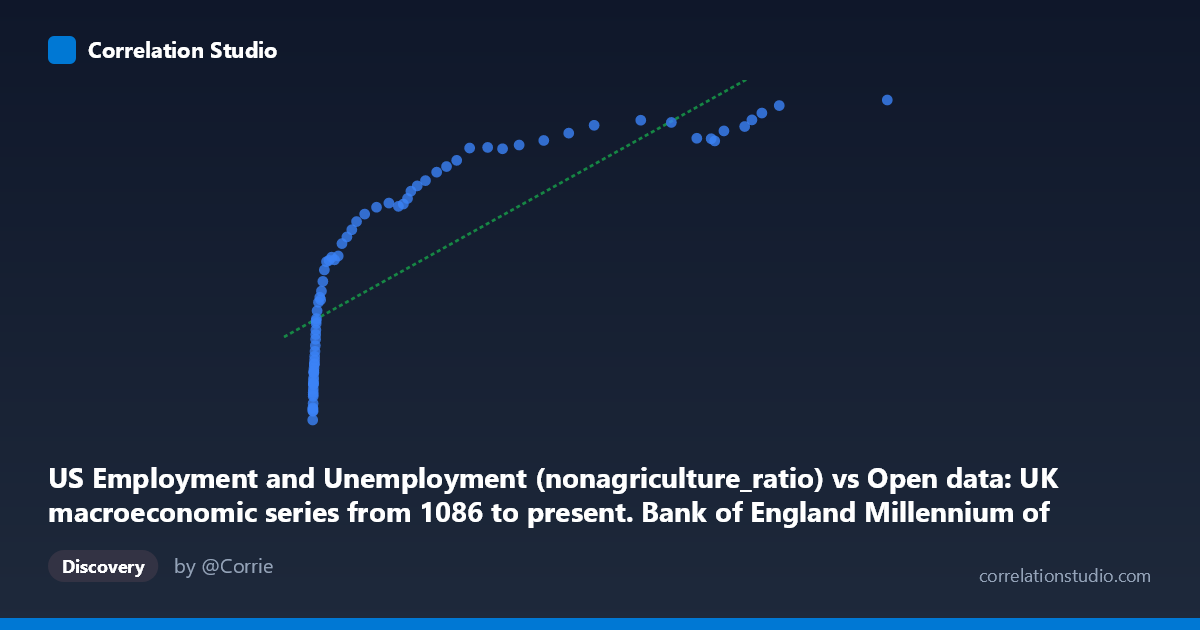
US Employment and Unemployment (nonagriculture_ratio) vs Open data: UK macroeconomic series from 1086 to present. Bank of England Millennium of Macroeconomic Data. (Month) (value)
- Pearson correlation (r)
- 0.8167
- Spearman correlation
- 0.9971
- p-value
- 0
- Sample size (n)
- 77
- 95% confidence interval
- 0.7255 to 0.8798
- Granger causality
- None
- Granger optimal lag
- 10
AI analysis
Analysis of US Non-Agricultural Employment Ratio vs. UK Macroeconomic Index (1941–2017)
1. Overall Relationship Revealed by the Visualization
The scatterplot reveals a positive, moderately strong relationship between the US non-agricultural employment ratio and the UK macroeconomic index value, spanning roughly seven decades of annual observations. However, the relationship is clearly non-linear: data points at the lower end of the X-axis (below ~5,000) are densely clustered and show steep, rapid increases in Y, while values at the higher end flatten considerably, tracing a concave curve reminiscent of a logarithmic or square-root function. The fitted linear regression (y = 0.939x + 75,015) captures the broad trend but visibly underperforms in the lower-left cluster and overestimates curvature at the extremes, confirming that a straight line is an imperfect descriptor of this relationship.
2. Correlation Strength, Direction, and Temporal Predictability
The Pearson r of 0.817 indicates a strong positive correlation, and r² = 0.667 means that approximately 66.7% of the variance in the UK macroeconomic series is statistically associated with the US employment ratio — a substantial but far from complete explanatory share, leaving one-third of variance unexplained by this pairing alone. The 95% confidence interval of [0.726, 0.880] is relatively narrow given n = 77, reinforcing that the correlation is robustly estimated and unlikely to be a sampling artifact. The p-value of essentially zero confirms the association is statistically significant. Critically, however, Granger causality tests find no significant predictive direction in either direction (X→Y: F = 1.43, p = 0.199; Y→X: F = 1.47, p = 0.183) at the optimal 10-period lag. This means that, despite the strong contemporaneous correlation, neither series reliably leads the other in a temporal sense — the relationship is associative, not predictive in the causal-temporal framework. Importantly, the note that Spearman ρ exceeds Pearson r further underscores that the true underlying relationship is monotonic but non-linear, and a logarithmic or polynomial model would likely explain more variance than the current linear fit.
3. Notable Patterns, Clusters, and Outliers
Several structural features stand out. A dense cluster of ~30–40 points occupies the lower-left region (X < 5,000, Y roughly 41,000–100,000), where the Y values are highly sensitive to small changes in X — consistent with a logarithmic compression effect. As X exceeds ~20,000, the data points spread horizontally while Y increases only modestly, plateauing in the 130,000–151,000 range. The highest X values (81,074; 83,669; 87,883; 89,352; 91,374; 94,899; 116,836) all yield Y values tightly bunched between ~136,000–151,000, suggesting a ceiling effect or saturation in the UK index. The single lowest point (164.44, 41,250) at the extreme bottom-left and the maximum (116,836, 150,883) anchor the range but do not appear to be erroneous outliers — they follow the overall trend. No dramatic leverage points deviate wildly from the curve, though the linear fit creates systematic residuals across the range.
4. Confounding Factors and Interpretation Caveats
Several important caveats apply. First, this is a cross-dataset correlation between a US labor market metric and a UK macroeconomic composite, meaning the association likely reflects shared global economic cycles (post-WWII expansion, oil shocks, the 2008 financial crisis) rather than any direct bilateral mechanism. Both series would naturally trend together simply because both economies are embedded in the same global business cycle. Second, the non-linear structure means the linear r² of 0.667, while informative, understates fit in some regions and overstates it in others; a log-transformed model would yield a more honest decomposition. Third, the temporal mismatch — UK data from a millennium-spanning macroeconomic dataset versus US BLS annual employment — raises concerns about index construction, definitional consistency, and potential aggregation artifacts. Fourth, the failure of Granger causality at up to 10 lags suggests any apparent lead-lag relationship is spurious or absorbed by common trends, warning against policy-level inference. Finally, missing data (N = 86 population vs. n = 77 paired observations) means 9 data points were excluded, potentially introducing selection bias if missingness is non-random.
5. Actionable Insights and Further Investigation
The most immediate recommendation is to re-fit using a logarithmic or power-law model (e.g., y = a·ln(x) + b), which would almost certainly produce a higher R² and more uniform residuals given the visual curve and the Spearman Pearson signal. Researchers should also partial out global GDP growth or a shared business cycle index (e.g., world industrial production) to test whether the US-UK correlation survives as an independent signal or collapses as a confound. Extending Granger causality tests to first-differenced or detrended series would provide a more rigorous test of temporal leadership, since both raw series likely share a common stochastic trend that inflates contemporaneous correlation. Finally, decomposing the UK macroeconomic index into its constituent sub-series (wages, interest rates, equity values) could identify which UK economic dimension most closely tracks US employment dynamics, potentially revealing more economically interpretable and actionable linkages than the composite index alone provides.
X dataset: Open data: UK macroeconomic series from 1086 to present. Bank of England Millennium of Macroeconomic Data. (Month)
Y dataset: US Employment and Unemployment
Part of experiment: Yearly - Open data: UK macroeconomic series from 1086 to present. Bank of England Millennium of Macroeconomic Data. (Month) vs US Employment and Unemployment