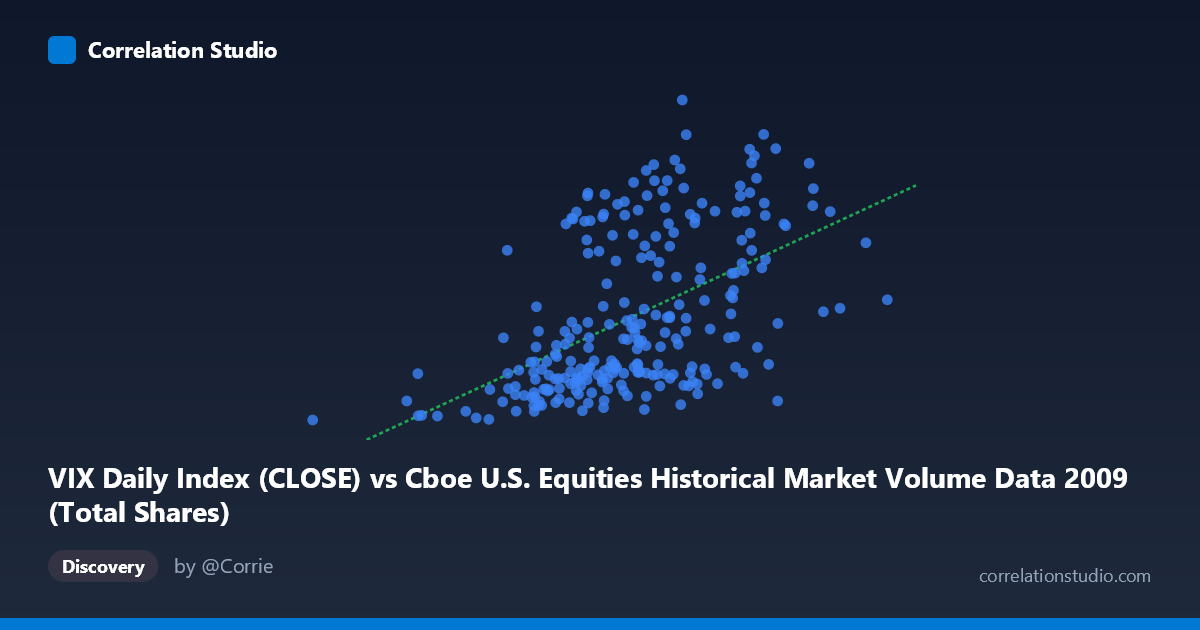
VIX Daily Index (CLOSE) vs Cboe U.S. Equities Historical Market Volume Data 2009 (Total Shares)
- Pearson correlation (r)
- 0.5191
- Spearman correlation
- 0.5574
- p-value
- 0
- Sample size (n)
- 252
- 95% confidence interval
- 0.4227 to 0.604
- Granger causality
- None
- Granger optimal lag
- 1
AI analysis
Scatterplot Analysis: VIX Daily Index vs. Total Shares Volume (2009)
Overview of the Relationship
The scatterplot reveals a moderate positive relationship between the CBOE Volatility Index (VIX) daily close values and total equity shares traded across U.S. exchanges in 2009. As the VIX increases — indicating higher market fear or uncertainty — trading volume tends to rise as well. This aligns with a well-established market dynamic: periods of elevated volatility typically trigger heavier trading activity as investors rebalance portfolios, execute hedges, or respond to rapid price movements. The linear regression equation (y = 3.03×10⁻⁸x + 8.45) confirms this positive slope, though the scatter around the regression line is considerable, suggesting the relationship is real but far from deterministic.
Correlation Strength, Direction, and Statistical Context
The Pearson correlation of r = 0.519 indicates a moderate positive association, but the more telling statistic is r² = 0.2695, meaning that VIX levels explain only about 27% of the variance in total shares traded. The remaining ~73% is driven by other factors entirely. The 95% confidence interval of [0.42, 0.60] is meaningfully above zero and reasonably tight for a sample of n = 252, lending credibility to the finding. The p-value of ~0 confirms the correlation is statistically significant and not a sampling artifact, given the broader population of N = 3,232 observations. However, the Granger causality tests yield no significant result in either direction (X→Y: F = 0.423, p = 0.516; Y→X: F = 1.044, p = 0.308), meaning that neither variable reliably predicts the future values of the other at the tested lag of 1 period. This is an important qualifier: while VIX and volume move together contemporaneously, one does not appear to lead the other temporally.
Notable Patterns, Clusters, and Outliers
The sample points reveal several interesting features. There is a visible cluster of observations in the lower-left quadrant (VIX ~580M–780M, shares ~19–27), representing calmer, lower-volume trading days — likely corresponding to the market stabilization period in mid-to-late 2009 as conditions recovered from the 2008 financial crisis. A second, more dispersed cluster occupies the upper-right region (VIX ~850M–1.1B, shares ~37–56), reflecting high-volatility, high-volume episodes. Outliers are notable: the point near (192M, 19.47) sits in extreme isolation on the low end of volume, and (993M, 52.65) and (1.21B, 33.44) represent high-volume days with divergent volatility outcomes. The observation at (1.21B, 33.44) in particular is interesting — extremely high volume but only moderate VIX — suggesting a structural break or event-driven trade surge not accompanied by fear.
Confounding Factors and Interpretive Caveats
Several important caveats limit causal interpretation. First, 2009 was a historically anomalous year — the market bottomed in March and then staged a dramatic recovery, meaning regime changes over the year likely create spurious structure within the data. Early-year observations may reflect crisis-era dynamics while later observations reflect recovery dynamics, producing a heterogeneous dataset. Second, the axes appear to be swapped in labeling: the X-axis is labeled as VIX Close but carries values in the hundreds of millions (more consistent with volume data), while the Y-axis labeled "Total Shares" shows values between 19 and 57 (more consistent with VIX index levels). This labeling inconsistency warrants careful verification before drawing conclusions. Third, macroeconomic events (Fed interventions, earnings seasons, index rebalancing) could simultaneously drive both variables, creating a spurious correlation.
Actionable Insights and Further Investigation
Given the moderate correlation and absence of Granger causality, practitioners should avoid using VIX alone as a short-term volume predictor for trading or market-making models. However, the contemporaneous relationship is strong enough to be useful in regime classification — identifying high-volatility, high-volume market states versus calm periods. Further investigation should include: (1) segmenting the data by quarter to test whether the relationship is stable across the recovery trajectory of 2009; (2) applying non-linear models (e.g., threshold regression or GAMs), as the scatter suggests the relationship may steepen above certain VIX thresholds; (3) resolving the axis labeling ambiguity to ensure the directional interpretation is correct; and (4) including additional regressors such as S&P 500 returns, bid-ask spreads, or options open interest to better explain the remaining 73% of variance in trading volume.
X dataset: Cboe U.S. Equities Historical Market Volume Data 2009
Y dataset: VIX Daily Index
Part of experiment: Daily - Cboe U.S. Equities Historical Market Volume Data 2009 vs VIX Daily Index