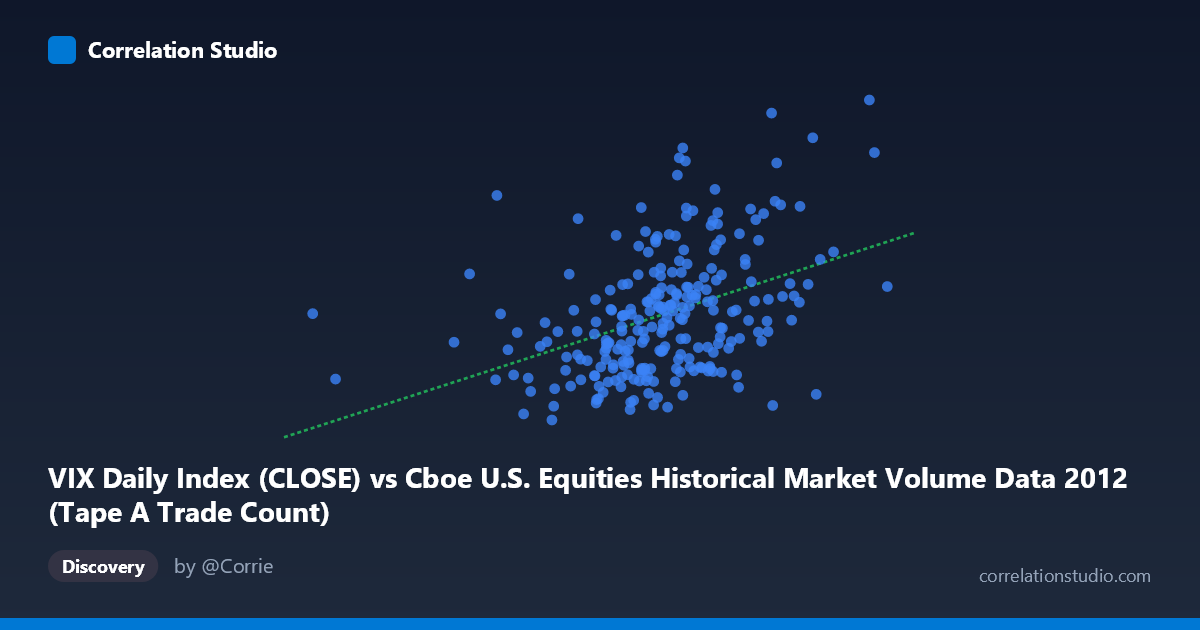
VIX Daily Index (CLOSE) vs Cboe U.S. Equities Historical Market Volume Data 2012 (Tape A Trade Count)
- Pearson correlation (r)
- 0.4096
- Spearman correlation
- 0.4339
- p-value
- 0
- Sample size (n)
- 250
- 95% confidence interval
- 0.3008 to 0.5079
- Granger causality
- None
- Granger optimal lag
- 1
AI analysis
Analysis: VIX Daily Index vs. Tape A Trade Count (2012)
Relationship Overview
The scatterplot reveals a modest positive relationship between the Cboe VIX Daily Index (Close) and the Tape A Trade Count for U.S. equities in 2012. As market volume (X) increases, the VIX tends to rise, which aligns with the intuitive financial logic that higher trading activity often coincides with elevated market uncertainty or volatility. The linear regression equation (y = 7.165E-06x + 10.609) confirms this upward slope, though the relationship is far from deterministic. The scatter of points around the regression line is considerable, indicating that many observations deviate substantially from predicted values, and the relationship is better described as a broad tendency than a tight coupling.
Correlation Strength and Statistical Significance
The Pearson correlation of r = 0.4096 reflects a weak-to-moderate positive association. More importantly, the R² of 0.1678 means that only 16.8% of the variance in VIX is explained by Tape A Trade Count, leaving over 83% attributable to other factors. The 95% confidence interval of [0.3008, 0.5079] is meaningfully above zero and does not contain zero, reinforcing that the correlation is real rather than artifactual. The p-value of 1.562E-11 confirms overwhelming statistical significance given n = 250 paired observations drawn from a population of 3,750, so the signal is reliable. However, Granger causality testing tells a sobering story: neither direction (X→Y: F = 0.077, p = 0.782; Y→X: F = 0.338, p = 0.562) achieves significance at any conventional threshold, meaning that neither variable temporally predicts the other with a one-period lag. In practical terms, knowing yesterday's trade count does not meaningfully help forecast today's VIX, and vice versa — the correlation is contemporaneous rather than predictive.
Notable Patterns, Clusters, and Outliers
Several structural features are visible in the sampled data. There is a dense central cluster concentrated in the X range of roughly 900,000–1,200,000 with VIX values between approximately 14 and 20, suggesting typical market conditions dominate the 2012 trading year. However, a notable upper-right cluster of points — including observations near (1,031,530, 23.56), (1,035,061, 24.27), (1,046,601, 24.14), and (963,117, 22.22) — represents elevated VIX readings coinciding with moderate-to-high volume, likely corresponding to specific volatility episodes (e.g., European debt crisis flare-ups in early 2012). Conversely, some low-X, low-Y points such as (744,458, 13.70) and (732,427, 17.06) appear as potential outliers on the lower volume extreme, possibly reflecting holiday-shortened sessions or unusually quiet trading days. The spread widens at higher X values, suggesting mild heteroscedasticity — variance in VIX is not constant across the range of trade counts.
Confounding Factors and Interpretive Caveats
Several important caveats apply. First, reverse causality is structurally plausible: elevated VIX itself can drive defensive repositioning and hedging activity, generating more trades rather than the other way around. Second, omitted variables — such as macroeconomic announcements, Federal Reserve communications, earnings seasons, and geopolitical events — likely drive both variables simultaneously, inflating the observed correlation without implying a causal mechanism. Third, the dataset is confined to a single calendar year (2012), a period characterized by specific macro conditions including the eurozone crisis and U.S. election uncertainty; the correlation may not generalize to other market regimes. Fourth, Tape A specifically covers NYSE-listed securities, so the volume metric is a partial proxy for total market activity, potentially introducing measurement asymmetry relative to VIX, which is calculated from broad S&P 500 options.
Actionable Insights and Further Investigation
Given the moderate correlation and absent Granger causality, practitioners should avoid using trade count alone as a leading indicator for VIX forecasting. Several follow-up investigations would be valuable: (1) expanding the time horizon across multiple years to test whether the r ≈ 0.41 relationship is stable across different volatility regimes (e.g., 2008 crisis vs. low-VIX 2017); (2) testing multi-period Granger lags beyond the optimal lag of 1, since market dynamics may operate on weekly rather than daily timescales; (3) incorporating Tape B and Tape C volumes to construct total market volume and reassess whether the relationship strengthens with a more complete market picture; and (4) segmenting the data by VIX regime (e.g., VIX < 15, 15–20, 20) to test whether the correlation is driven disproportionately by high-volatility episodes, which would suggest a non-linear or threshold relationship more appropriately modeled with regime-switching frameworks.
X dataset: Cboe U.S. Equities Historical Market Volume Data 2012
Y dataset: VIX Daily Index
Part of experiment: Daily - Cboe U.S. Equities Historical Market Volume Data 2012 vs VIX Daily Index