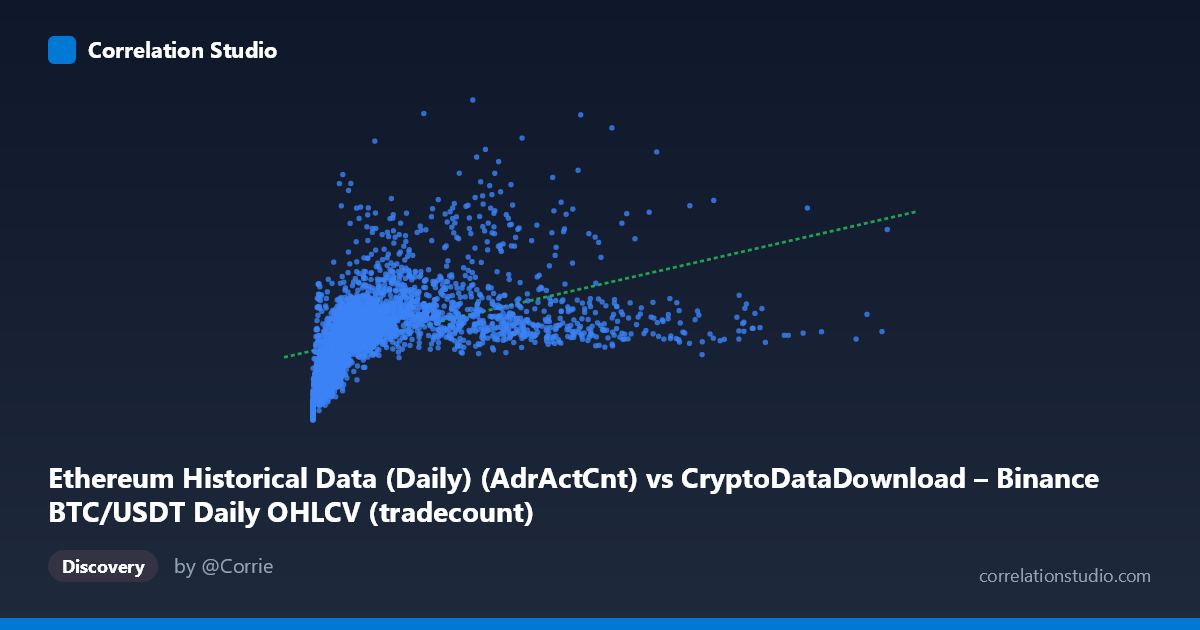
Ethereum Historical Data (Daily) (AdrActCnt) vs CryptoDataDownload – Binance BTC/USDT Daily OHLCV (tradecount)
- Pearson correlation (r)
- 0.4623
- Spearman correlation
- 0.7086
- p-value
- 0
- Sample size (n)
- 3191
- 95% confidence interval
- 0.4346 to 0.4892
- Granger causality
- None
- Granger optimal lag
- 10
- Time coverage
- 2017-08-17 to 2026-05-20
AI analysis
Analysis of the Relationship Between Ethereum Active Addresses (X) and BTC/USDT Trade Count (Y)
1. What the Visualization Reveals
The scatterplot shows a positive but noisy relationship between the two variables. Most data points cluster tightly in the lower-left region (X < 3,000,000; Y between 300,000–700,000), with a long right tail of increasingly sparse points extending to X ≈ 15,000,000. This distribution shape — dense clustering near the origin with a decaying tail — is a strong visual indicator of a right-skewed X variable (confirmed by the mean/stdev ratio: mean 1.97M vs stdev 2.24M) rather than a clean linear pairing. The relationship appears to flatten or plateau at higher X values, consistent with the note that Spearman ρ exceeds Pearson r.
2. Strength, Direction, and Statistical Confidence
The Pearson correlation (r = 0.462) indicates a moderate positive relationship, but r² = 0.214 means only about 21% of the variance in Y (trade count) is explained by X (active addresses) — roughly 79% of the variation is driven by other factors. The 95% CI [0.435, 0.489] is tight, and the p-value is effectively 0, so we can be confident the correlation itself is real and not a sampling artifact — but statistical significance here reflects the large sample size (n=3,191) more than practical predictive strength. Critically, the Granger causality tests show no significant predictive direction in either direction (X→Y: p=0.50; Y→X: p=0.78) at the optimal 10-period lag. This means neither series helps forecast the other's future values based on past values — the contemporaneous correlation does not imply a temporal lead-lag relationship, undermining any causal or forecasting narrative.
3. Notable Patterns and Outliers
Several structural quirks are visible: - Bimodal density: A tight core cluster (X < 500K) coexists with a stretched-out sparse tail (X 5M), suggesting either a regime change in Ethereum's active address counts over time or possible unit/scale inconsistencies in the data. - Curvature suggestion: The Spearman-vs-Pearson divergence implies the true relationship may be logarithmic or saturating — Y grows quickly with X initially, then plateaus, rather than increasing linearly indefinitely. - Low-X, high-Y outliers: Points like (152364, 614264) and (795201, 640023) sit above the regression line at low X, while high-X points like (8268695, 976428) and (15364010-range) don't scale proportionally, contributing to scatter and reducing r. - Extreme values: The X max (15.36M) is nearly 7x the mean, indicating heavy right-skew and potential leverage points that could be distorting the linear fit.
4. Confounding Factors and Caveats
This pairing is conceptually unusual: X is described as an Ethereum on-chain metric (active address count) while Y is a Binance BTC/USDT trade count — two different assets and data types (network activity vs. exchange trading activity). Any correlation is likely driven by a shared latent factor, such as: - Overall crypto market sentiment/cycles (bull/bear regimes) causing both metrics to rise and fall together - Long-term secular growth trends in blockchain/exchange adoption (2017–2026 span covers major market cycles) - Time-series autocorrelation inflating the apparent correlation without genuine causal linkage (a classic spurious-correlation risk when both series trend over multi-year periods)
The Granger non-causality result reinforces that this is likely a coincidental co-trending relationship rather than a mechanistic one.
5. Actionable Insights
- Detrend or difference the series before further correlation analysis to rule out spurious correlation from shared long-term trends (e.g., use % changes or first differences rather than levels). - Test a log-log or polynomial model given the Spearman/Pearson divergence — a log transform of X may linearize the relationship and improve fit. - Segment by market regime (bull vs. bear, or by year) to check if the correlation is stable or driven by a specific period. - Investigate the data pairing itself — cross-asset comparisons (ETH network data vs. BTC exchange data) may not have a strong theoretical rationale; consider comparing like-for-like metrics (e.g., ETH active addresses vs. ETH trade count, or BTC active addresses vs. BTC trade count) for cleaner causal inference. - Given no Granger causality, avoid using either series as a leading indicator for the other in forecasting models.
X dataset: CryptoDataDownload – Binance BTC/USDT Daily OHLCV
Y dataset: Ethereum Historical Data (Daily)
Part of experiment: Bitcoin - CryptoDataDownload – Binance BTC/USDT Daily OHLCV vs Ethereum Historical Data (Daily)