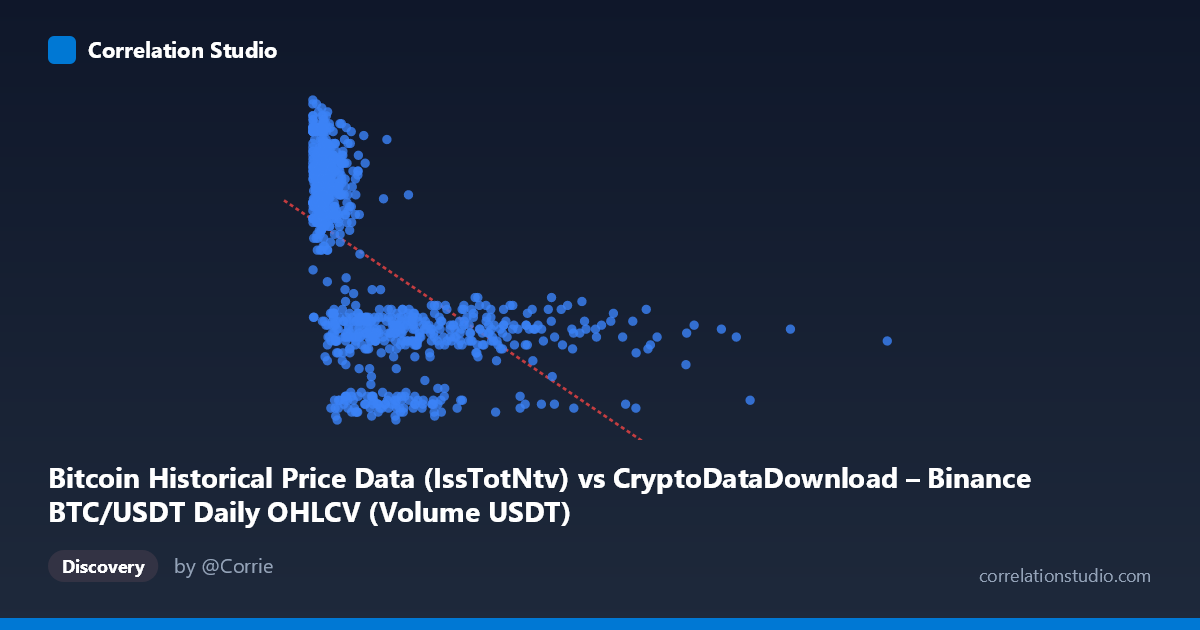
Bitcoin Historical Price Data (IssTotNtv) vs CryptoDataDownload – Binance BTC/USDT Daily OHLCV (Volume USDT)
- Pearson correlation (r)
- -0.5759
- Spearman correlation
- -0.7091
- p-value
- 0
- Sample size (n)
- 938
- 95% confidence interval
- -0.6172 to -0.5315
- Granger causality
- None
- Granger optimal lag
- 10
- Time coverage
- 2017-08-20 to 2026-05-20
AI analysis
Analysis: Bitcoin "IssTotNtv" vs. Volume USDT Relationship
1. What the Visualization Reveals
The scatterplot shows a clear inverse relationship between the X variable (labeled as Bitcoin price data, though the magnitude—ranging into the billions—suggests this is actually a cumulative or issuance-related metric rather than raw price) and the Y variable (Volume USDT, ranging 350–2375). As X increases, Y systematically decreases, though the relationship is not tightly linear. Points cluster densely at low X values (under ~1 billion) with high Y values (1600–2200), then thin out and flatten toward low Y values (400–1000) as X climbs into the multi-billion range.
2. Strength, Direction, and Statistical Confidence
The Pearson correlation of r = -0.576 indicates a moderate-to-strong negative relationship. The r² of 0.332 means only about 33% of the variance in Y is explained by X — leaving two-thirds of Y's variability driven by other factors, noise, or non-linear dynamics not captured by this simple linear model. The 95% CI [-0.617, -0.532] is fairly narrow and does not cross zero, and the p-value ≈ 0 confirms this correlation is highly statistically significant and not due to chance, given the large sample (n=938). However, statistical significance should not be conflated with practical predictive strength — r² of 0.33 leaves substantial unexplained variance. Critically, the Granger causality tests show no significant predictive direction in either direction (X→Y p=0.122, Y→X p=0.757), meaning that despite the contemporaneous correlation, neither variable is significantly useful for forecasting the other over time. This suggests the correlation may be driven by a shared underlying trend (e.g., both tracking overall market maturation/time) rather than a genuine causal or lead-lag mechanism.
3. Notable Patterns and Non-linear Features
The data clearly exhibits a curved, non-linear decay pattern rather than a straight-line relationship — high density and steep dropoff at low X, followed by a long flattening tail at high X. This is corroborated by the note that Spearman ρ exceeds Pearson r, indicating the monotonic rank relationship is stronger than the linear fit suggests. This points to a logarithmic or power-law relationship (Y declining roughly with log(X) or X^-k) being more appropriate than the linear regression currently used. The extreme X-axis range (from ~1.3 million to ~12.3 billion, spanning four orders of magnitude) reinforces that a log-transformation of X would likely linearize the relationship and improve fit substantially.
4. Confounding Factors and Caveats
Several caveats apply. First, the two variables are pulled from different datasets/metrics (BTC price/issuance vs. USDT volume) and may both be proxies for time or market phase — Bitcoin's network metrics and trading volumes have both evolved secularly since 2017, so the "correlation" may partly reflect a shared temporal trend rather than direct interaction. Second, the extreme right-skew of X (mean $1.32B vs. stdev $1.64B, with a max over $12B) means a small number of high-X points could disproportionately influence the linear fit. Third, the lack of Granger causality undermines any narrative of one variable driving the other — it's more consistent with both being co-dependent on a third factor (overall market cycle, adoption phase, or exchange-specific dynamics).
5. Actionable Insights and Next Steps
- Re-fit with a log or power transformation on X (and possibly Y) to test whether this substantially improves R² given the Spearman/Pearson discrepancy. - Investigate a third common driver (e.g., calendar time, market cap, or bull/bear cycle phase) using partial correlation to see if the X-Y link is spurious/mediated. - Verify variable definitions — the extreme magnitude of X (up to $12.3B) is inconsistent with typical daily price data, suggesting this may actually be a cumulative or issuance-based metric; clarifying this will change interpretation substantially. - Given no Granger causality, avoid using either series to forecast the other; instead treat the correlation as descriptive/structural rather than predictive. - Consider segmenting the analysis by time period (e.g., yearly cohorts) to check whether the relationship is stable or itself an artifact of Bitcoin's changing market structure over 2017–2026.
X dataset: CryptoDataDownload – Binance BTC/USDT Daily OHLCV
Y dataset: Bitcoin Historical Price Data
Part of experiment: Bitcoin - CryptoDataDownload – Binance BTC/USDT Daily OHLCV vs Bitcoin Historical Price Data