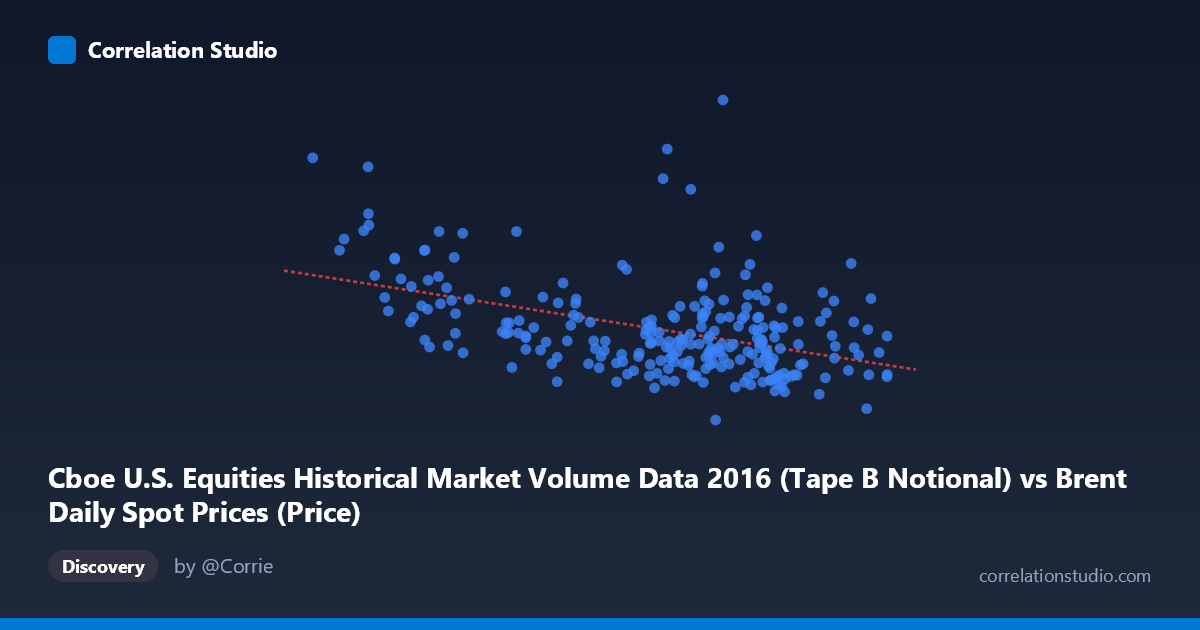
Cboe U.S. Equities Historical Market Volume Data 2016 (Tape B Notional) vs Brent Daily Spot Prices (Price)
- Pearson correlation (r)
- -0.4436
- Spearman correlation
- -0.3913
- p-value
- 0
- Sample size (n)
- 251
- 95% confidence interval
- -0.5379 to -0.3384
- Granger causality
- None
- Granger optimal lag
- 10
AI analysis
Analysis: Brent Crude Oil Prices vs. Cboe Tape B Notional Volume (2016)
Relationship Overview The scatterplot reveals a moderate negative relationship between Cboe U.S. Equities Tape B notional trading volume (X-axis) and Brent crude oil spot prices (Y-axis) across 251 trading days in 2016. The linear regression equation (y = -1.036×10⁸x + 9.578×10⁹) confirms this inverse pattern: as Tape B notional volume increases, Brent crude prices tend to decline. Visually, the data points form a downward-sloping cloud, with lower crude prices clustering around higher volume values (roughly 45–55 range) and higher crude prices appearing more frequently at lower volume values (roughly 26–35 range).
Correlation Strength and Statistical Significance The correlation of r = -0.4436 reflects a moderate negative association, but the explanatory power is limited — r² = 0.197 means that only 19.7% of the variance in Brent crude prices is explained by Tape B notional volume. The remaining ~80% of price variation is driven by factors entirely outside this model. The 95% confidence interval of [-0.538, -0.338] is meaningfully narrow and does not cross zero, and the p-value of 1.58×10⁻¹³ confirms this correlation is statistically significant well beyond conventional thresholds given n = 251. However, statistical significance here should not be conflated with practical significance — the modest r² limits real-world utility. Critically, Granger causality tests in both directions fail to reach significance (X→Y: p = 0.721; Y→X: p = 0.806), meaning neither variable demonstrates temporal predictive power over the other at the optimal 10-period lag. The relationship may be contemporaneous or entirely spurious.
Notable Patterns and Outliers Several influential outliers are clearly visible and deserve attention. The leftmost data points — particularly around X ≈ 26–34 — display notably elevated Y values (crude prices reaching ~8–12.7 billion notional range), pulling the regression line and inflating the apparent correlation. Points such as (26.01, ~10.8B) and (27.59, ~8.1B) represent extreme leverage observations. In the denser cluster (X ≈ 44–52), the relationship is far less pronounced and the vertical spread is substantial, suggesting the negative trend may be driven primarily by those low-volume, high-price extremes rather than a consistent linear mechanism throughout the data range. There is also visible heteroscedasticity — variance in Y is considerably larger at low X values than at high X values.
Confounding Factors and Caveats A fundamental interpretive caveat is that these two variables — crude oil spot prices and U.S. equity notional trading volume on a specific tape — are not naturally linked by direct economic mechanism. Both are influenced heavily by shared macroeconomic and market-wide factors in 2016: the oil price recovery from early-year lows, Brexit volatility (June 2016), U.S. election uncertainty (November 2016), and OPEC production decisions. The low-volume, high-price region likely reflects early 2016 when crude was rebounding from multi-year lows amid different market microstructure conditions. This temporal confounding — where both variables are independently responding to the same calendar-driven market events — is the most probable explanation for the observed correlation. The absence of Granger causality strongly supports this interpretation.
Actionable Insights and Further Investigation Given the weak explanatory power and absence of directional causality, this correlation should not be used for predictive modeling in its current form. Further investigation should consider: (1) decomposing the time series to test whether the correlation persists after removing shared macro trends and seasonality; (2) examining whether the relationship is driven entirely by specific sub-periods (e.g., Q1 2016 oil recovery) by running rolling-window correlations; (3) testing alternative volume metrics (total market notional rather than Tape B specifically) to assess whether this finding is robust or tape-specific; and (4) incorporating a multivariate framework with known crude price drivers (USD index, inventory data, OPEC announcements) to determine whether volume retains any marginal explanatory power after controlling for fundamentals.
X dataset: Brent Daily Spot Prices
Y dataset: Cboe U.S. Equities Historical Market Volume Data 2016
Part of experiment: Daily - Brent Daily Spot Prices vs Cboe U.S. Equities Historical Market Volume Data 2016