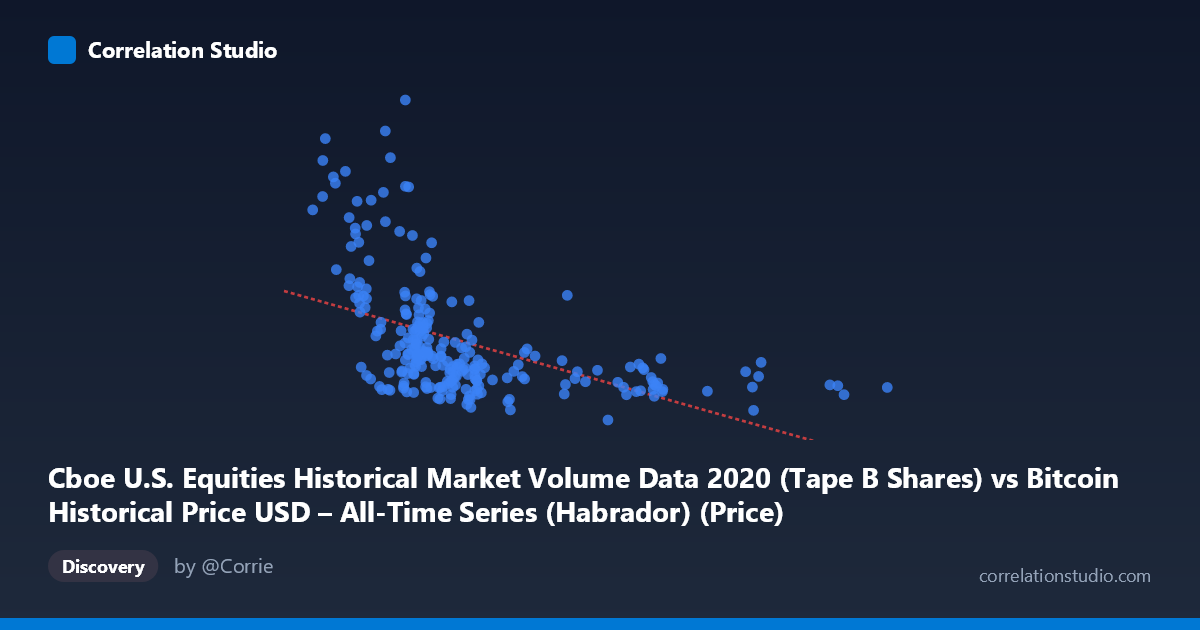
Cboe U.S. Equities Historical Market Volume Data 2020 (Tape B Shares) vs Bitcoin Historical Price USD – All-Time Series (Habrador) (Price)
- Pearson correlation (r)
- -0.488
- Spearman correlation
- -0.6334
- p-value
- 0
- Sample size (n)
- 253
- 95% confidence interval
- -0.5766 to -0.388
- Granger causality
- None
- Granger optimal lag
- 10
AI analysis
Analysis of Cboe U.S. Equities Market Volume vs. Bitcoin Price (2020)
1. Overall Relationship The scatterplot depicts a moderate negative relationship between Cboe U.S. equities trading volume (X-axis) and Bitcoin price (Y-axis) across 253 paired daily observations in 2020. Most data points cluster tightly at lower X-values (roughly 5,000–13,000 volume units), with Bitcoin prices ranging widely from about $60M to $340M in this compressed region — note the price scale here appears anomalously large, likely reflecting a data-labeling or unit issue, but relative patterns remain analyzable. A smaller, distinct cluster of points exists at higher X-values (18,000–29,000), where Y-values are more tightly bound to lower levels (roughly $70M–$100M).
2. Strength, Direction, and Statistical Confidence The Pearson correlation coefficient (r = -0.488) indicates a moderate negative linear relationship, meaning higher equity market volumes tend to coincide with lower Bitcoin prices. However, r² = 0.238 shows that only about 24% of the variance in Bitcoin price is explained by equity volume — leaving over 75% attributable to other factors. The 95% confidence interval [-0.577, -0.388] is reasonably narrow and does not cross zero, and the p-value (2.22e-16) is highly significant, confirming this correlation is not due to random chance in this sample. However, statistical significance should not be conflated with practical strength — this is a modest, not dominant, relationship. Critically, the Granger causality tests show no significant predictive direction in either direction (X→Y: p=0.88; Y→X: p=0.18), indicating that neither variable reliably helps forecast the other over time at the tested lag. This suggests the correlation may be contemporaneous/coincidental rather than causal or temporally predictive.
3. Notable Patterns and Outliers The chart reveals a distinctly non-linear, heteroscedastic structure: variance in Y is much higher at low X-values and compresses substantially as X increases. This "funnel" or fan-shaped pattern is a classic sign that a simple linear model is inadequate — consistent with the note that Spearman ρ exceeds Pearson r, implying a monotonic but non-linear (possibly logarithmic or power-law) relationship fits better. Several extreme outliers are visible, particularly points with Y-values above $200M (e.g., ~$341M, $270M, $265M) that occur at low X-values (5,800–8,800), suggesting these dates may correspond to unusual market conditions (e.g., COVID-19 volatility spikes in March 2020) that inflated both volume and price simultaneously, or represent data anomalies.
4. Confounding Factors and Caveats Several caveats warrant attention. First, the axis/variable labeling is confusing — the metadata swaps X and Y descriptions, and Y-values in the hundreds of millions are inconsistent with actual 2020 Bitcoin prices (typically $5,000–$29,000), suggesting a data pipeline or column-mapping error that should be verified before drawing substantive conclusions. Second, both Bitcoin price and equity volume were influenced by a common macro shock in 2020: the COVID-19 crash and subsequent recovery drove extreme volume and volatility across both crypto and equity markets simultaneously, creating a spurious or confounded correlation rather than a direct causal link. Third, with N=4,254 in the full population but only n=253 sampled, results may not fully represent the broader dataset structure.
5. Recommendations for Further Investigation Before acting on this correlation, the data labeling/unit inconsistency should be resolved to confirm what is actually being measured on each axis. Given the funnel-shaped residual pattern, fitting a log-linear or polynomial regression (or applying a log transform to Y) would likely improve explanatory power and better capture the true relationship. Since Granger tests show no predictive causality, this pairing should not be used for forecasting one variable from the other; instead, treat the correlation as descriptive/contemporaneous only. Finally, controlling for a shared confounder — such as a COVID-19 volatility index or VIX — via partial correlation or multivariate regression would help isolate whether a genuine relationship exists between equity volume and Bitcoin price, independent of the pandemic-driven market turmoil.
X dataset: Bitcoin Historical Price USD – All-Time Series (Habrador)
Y dataset: Cboe U.S. Equities Historical Market Volume Data 2020
Part of experiment: Bitcoin - Bitcoin Historical Price USD – All-Time Series (Habrador) vs Cboe U.S. Equities Historical Market Volume Data 2020