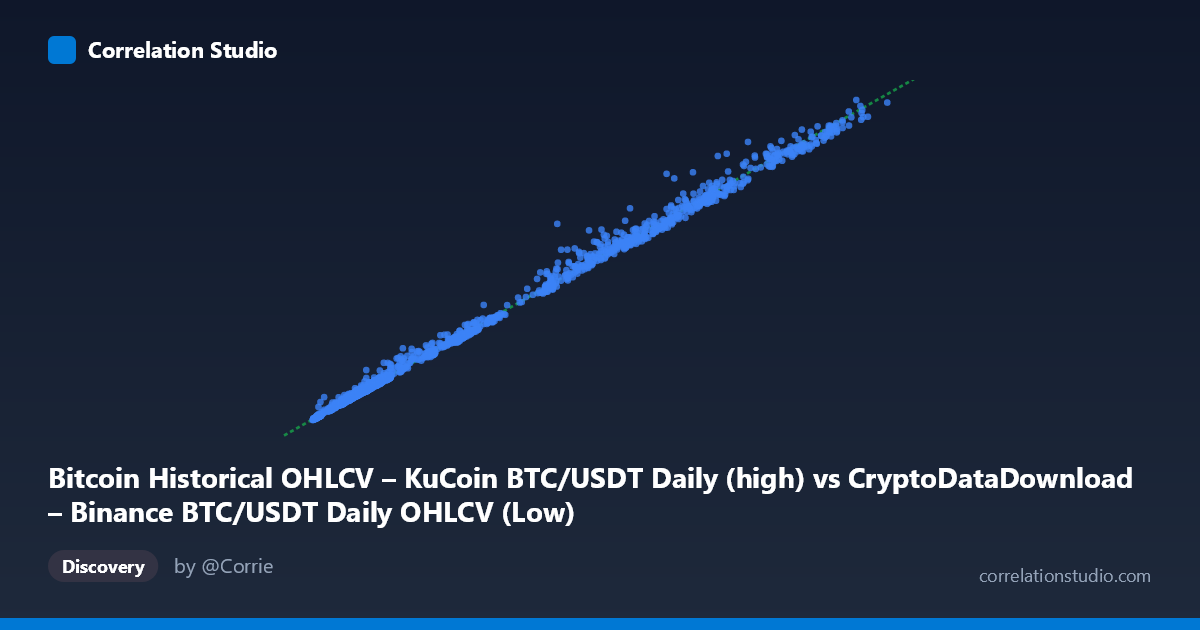
Bitcoin Historical OHLCV – KuCoin BTC/USDT Daily (high) vs CryptoDataDownload – Binance BTC/USDT Daily OHLCV (Low)
- Pearson correlation (r)
- 0.9983
- Spearman correlation
- 0.9973
- p-value
- 0
- Sample size (n)
- 1861
- 95% confidence interval
- 0.9982 to 0.9985
- Granger causality
- None
- Granger optimal lag
- 10
AI analysis
Analysis: BTC/USDT Daily High (Binance) vs. Daily Low (KuCoin)
1. Relationship Overview The scatterplot depicts an almost perfectly linear relationship between Binance's daily high price and KuCoin's daily low price for BTC/USDT. Points hug a straight line running from the lower-left (~$3,000) to the upper-right (~$65,000+), with virtually no visible scatter or dispersion around the trend line. This is expected given both variables represent the same underlying asset (Bitcoin) priced in the same quote currency (USDT) on two major exchanges — they are effectively two measurements of the same market phenomenon rather than independent economic variables.
2. Strength, Direction, and Statistical Confidence The correlation is exceptionally strong and positive (r = 0.9983, r² = 0.9967), meaning 99.67% of the variance in KuCoin's daily low is explained by Binance's daily high. The tight 95% CI [0.9982, 0.9985] and p-value of 0 indicate this relationship is not a statistical fluke — with n=1,861 daily observations spanning five years (2017–2022), the estimate is extremely precise and stable. Practically, this means the two series move in near-lockstep; knowing one gives you a highly reliable estimate of the other. However, the Granger causality test shows no significant predictive direction in either direction (X→Y: p=0.30; Y→X: p=0.30). This is an important nuance: while the two series are contemporaneously correlated, neither exchange's price leads the other in a way that offers forecasting advantage at the tested lag (10 periods). This is consistent with efficient, arbitrage-linked markets — price discovery happens too fast (sub-daily) for daily-lag Granger tests to detect directional lead/lag.
3. Patterns, Clusters, and Non-linear Features The data shows a slight fan-out or widening dispersion at higher price levels (e.g., points like 43994→48647 or 40675→45144 show larger gaps between X and Y than points in the sub-$10,000 range). This is typical of financial price data, where volatility scales with price level (heteroscedasticity) rather than remaining constant in absolute terms. Clusters are visible: a dense concentration in the $3,000–$20,000 range (reflecting BTC's multi-year consolidation periods) and sparser points in the $40,000–$66,000 range (reflecting the 2021 bull run highs). No clear outliers or breaks in linearity are apparent — the relationship holds across the entire price range, though the higher end has fewer data points and thus less density to confirm behavior.
4. Confounding Factors and Caveats The primary caveat is that this isn't really a correlation between two independent phenomena — it's two exchanges pricing the same asset, so extremely high correlation is structurally guaranteed via arbitrage. The "high" and "low" fields also introduce a built-in relationship: daily high should almost always exceed daily low, creating a mechanical floor/offset (reflected in the regression intercept of 66.622 and slope of ~1.06, suggesting KuCoin's low tends to run slightly above what a 1:1 relationship would predict, or Binance's high has slightly more upside spread). Additional confounders include: exchange-specific liquidity differences, timestamp/timezone misalignment in "daily" boundaries, and periods of exchange-specific anomalies (flash crashes, outages, or wash trading) that could cause temporary divergence not visible at this aggregate scale.
5. Suggestions for Further Investigation Given the near-tautological correlation, more insight would come from studying the residuals (Y − predicted Y) rather than the raw correlation — this could reveal specific dates where KuCoin and Binance prices diverged meaningfully (e.g., due to liquidity crunches, exchange-specific news, or arbitrage delays), which are the actually interesting data points for risk or trading strategy purposes. Since daily-lag Granger causality shows no direction, a natural next step is testing higher-frequency data (hourly/minute-level) where lead-lag microstructure effects between exchanges are more likely to appear before arbitrage closes the gap. Finally, examining the spread (High − Low) as its own time series, or normalizing by price level (percentage spread), would help assess relative liquidity/volatility differences between the two exchanges rather than being dominated by the shared price trend.
X dataset: CryptoDataDownload – Binance BTC/USDT Daily OHLCV
Y dataset: Bitcoin Historical OHLCV – KuCoin BTC/USDT Daily
Part of experiment: Bitcoin - CryptoDataDownload – Binance BTC/USDT Daily OHLCV vs Bitcoin Historical OHLCV – KuCoin BTC/USDT Daily