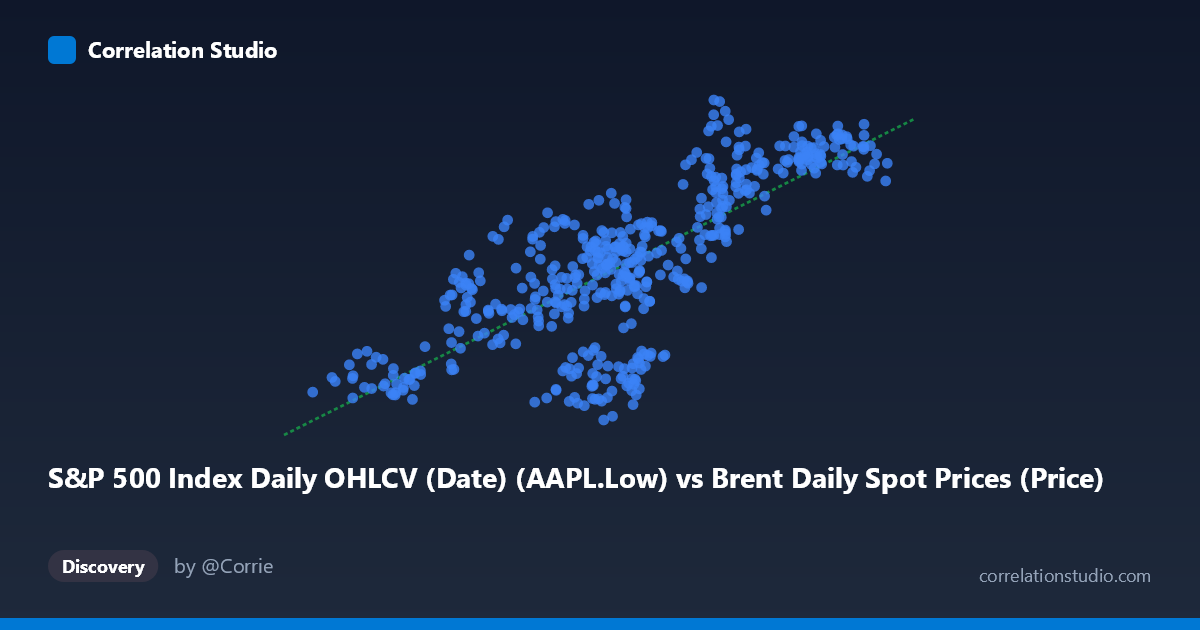
S&P 500 Index Daily OHLCV (Date) (AAPL.Low) vs Brent Daily Spot Prices (Price)
- Pearson correlation (r)
- 0.7704
- Spearman correlation
- 0.7654
- p-value
- 0
- Sample size (n)
- 504
- 95% confidence interval
- 0.7324 to 0.8037
- Granger causality
- None
- Granger optimal lag
- 1
AI analysis
Scatterplot Analysis: AAPL Low Price vs. Brent Crude Oil Spot Price (2015–2017)
Relationship Overview The scatterplot reveals a moderate-to-strong positive relationship between Apple's daily low stock price (AAPL.Low) and Brent crude oil spot prices over the two-year window from February 2015 to February 2017. As AAPL's low price increases across its range of approximately $26 to $66, Brent crude prices tend to rise correspondingly from roughly $89 to $135 per barrel. The linear regression equation (y = 1.013x + 63.05) indicates a near 1:1 slope, meaning each one-dollar increase in AAPL's low is associated with approximately a one-dollar increase in Brent prices — a numerically tidy but almost certainly coincidental relationship given the fundamentally different nature of these two assets.
Correlation Strength and Statistical Significance The Pearson correlation of r = 0.7704 indicates a strong positive linear association, and the R² of 0.5936 means that approximately 59.4% of the variance in Brent crude prices is statistically "explained" by AAPL's low price within this sample — a remarkably high figure for two ostensibly unrelated assets. The 95% confidence interval of [0.7324, 0.8037] is relatively narrow, suggesting the estimate is stable, and the p-value of essentially zero confirms the correlation is highly statistically significant given n = 504 paired observations. However, statistical significance here is somewhat misleading: with a large sample and a shared underlying time trend, inflated correlations are expected. Critically, the Granger causality tests show no significant predictive directionality in either direction (X→Y: F = 0.012, p = 0.912; Y→X: F = 0.263, p = 0.609), meaning neither variable helps forecast the other temporally, even at a one-period lag. This strongly undermines any causal interpretation.
Notable Patterns, Clusters, and Outliers The sample points reveal several structural features worth noting. There is a dense central cluster around AAPL.Low values of 43–55 and Brent prices of 105–125, suggesting this was the most common regime during the observation window. The lower-left region (AAPL.Low ~26–37, Brent ~89–110) likely corresponds to a specific sub-period — probably the oil price trough of late 2015 to early 2016 that coincided with a broader equity market selloff, temporarily depressing both series. A few high-leverage points appear in the upper-right quadrant (e.g., AAPL.Low ~64–66, Brent ~125–128) and one potential outlier stands out near (54.16, 134.84), where Brent is unusually high relative to the regression line. There is also visible heteroscedasticity: scatter appears wider at intermediate X values, which could slightly undermine the precision of the linear fit at those ranges.
Confounding Factors and Caveats The most significant caveat here is spurious correlation driven by shared time trends. Both AAPL stock and Brent crude prices declined sharply during 2015–2016 and recovered through 2016–2017, meaning both series are non-stationary and co-trending across the same calendar period. This shared macro-economic trajectory — driven by factors such as global growth concerns, Federal Reserve policy, and broader risk appetite — creates a spurious positive correlation that has nothing to do with any structural link between Apple's business and crude oil markets. The dataset labels themselves hint at potential metadata confusion: the X-axis column is labeled as coming from a "Brent Daily Spot Prices" dataset yet refers to AAPL.Low, and the Y-axis is labeled from an "S&P 500 Index" dataset yet refers to Brent prices — suggesting the datasets may have been joined on date without careful validation. This metadata inversion warrants verification before drawing any conclusions. Additionally, no stationarity transformation (e.g., differencing or log-returns) has been applied, which is standard practice before correlating financial time series.
Actionable Insights and Further Investigation Given the Granger causality null results and the likely spurious nature of the correlation, the immediate actionable insight is clear: this correlation should not be used for trading, hedging, or any predictive modeling between AAPL and Brent crude. For further investigation, analysts should: (1) difference both series or compute log-returns to remove trending behavior and retest correlation on stationary data, where the relationship is likely to collapse toward zero; (2) verify the dataset join logic to confirm the X and Y columns are correctly mapped given the apparent label inconsistency; (3) introduce common confounders such as the VIX, USD index, or S&P 500 index itself as control variables to determine whether residual correlation survives; and (4) apply rolling-window correlation analysis to test whether the relationship strengthens or disappears across sub-periods, which would help isolate whether the co-movement is regime-specific rather than structural.
X dataset: Brent Daily Spot Prices
Y dataset: S&P 500 Index Daily OHLCV (Date)
Part of experiment: Daily - Brent Daily Spot Prices vs S&P 500 Index Daily OHLCV (Date)