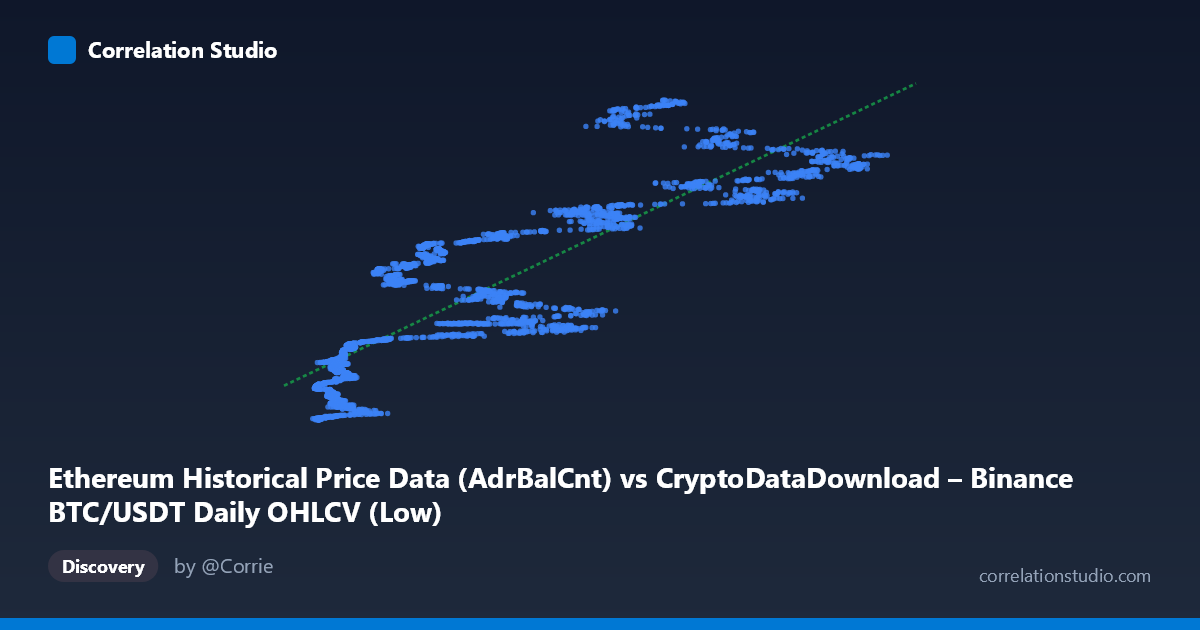
Ethereum Historical Price Data (AdrBalCnt) vs CryptoDataDownload – Binance BTC/USDT Daily OHLCV (Low)
- Pearson correlation (r)
- 0.8594
- Spearman correlation
- 0.8899
- p-value
- 0
- Sample size (n)
- 3191
- 95% confidence interval
- 0.85 to 0.8682
- Granger causality
- None
- Granger optimal lag
- 10
- Time coverage
- 2017-08-17 to 2026-05-20
AI analysis
Analysis: Ethereum Address Count vs. Binance BTC/USDT Price
1. What the Visualization Reveals
Despite the confusing column labels (the metadata appears mismatched — X is described as Ethereum "AdrBalCnt" while Y is described as BTC/USDT "Low" price, though the dataset title suggests this is really tracking Ethereum network activity against Bitcoin price), the scatterplot shows a strong positive, monotonic relationship between the two variables. As X increases from roughly 2,800 to 123,000, Y rises from under 3 million to nearly 193 million, with the data tracing a clear upward trend that appears slightly concave (faster growth at higher X values), suggesting the relationship may be better modeled as power-law or exponential rather than strictly linear.
2. Strength, Direction, and Uncertainty
The correlation is strong (r = 0.859, r² = 0.739), meaning about 74% of the variance in Y is explained by X — a substantial but not complete relationship, leaving roughly 26% of variance driven by other factors. The 95% CI [0.850, 0.868] is tight, and with p ≈ 0 across 3,191 paired observations, we can be highly confident this correlation is not due to sampling noise. However, correlation here should not be read as causation: Granger causality tests at the optimal lag (10 periods) show no significant predictive direction in either direction (X→Y: p=0.43; Y→X: p=0.22). This means neither series reliably helps forecast future values of the other beyond its own history — the strong contemporaneous correlation likely stems from both variables responding to a common underlying driver (most plausibly the overall crypto market cycle/bull-bear regime), rather than one causing the other.
3. Notable Patterns and Outliers
Several features stand out in the sample data: - Non-linear curvature: Low-X points (X < 10,000) cluster tightly with Y values under ~50 million, while high-X points (X 80,000) show Y values ranging widely from ~140M to ~193M — indicating heteroscedasticity (increasing variance at higher X). - Vertical scatter at similar X: e.g., X≈9,750–9,900 shows Y ranging from 10M to 29M; X≈77,000–89,000 shows Y from 141M to 191M. This scatter band widens as X grows, consistent with a power-law rather than linear fit. - Potential regime clusters: Data seems to separate into a "low-activity/low-price" cluster (X<15,000, Y<50M) and a "high-activity/high-price" cluster (X60,000, Y110M), with sparser transitional points — possibly reflecting distinct bull/bear market phases in the 2017-2026 time coverage rather than a continuous relationship.
4. Confounding Factors and Caveats
- Time-series autocorrelation: Both series are cumulative/trending crypto metrics over ~9 years; standard Pearson r assumes independent observations, but daily crypto data is highly autocorrelated, likely inflating the apparent r and invalidating the stated p-value's assumptions. - Common market cycle confound: Bitcoin price, Ethereum network usage, and overall crypto adoption are all driven by shared macro factors (liquidity, regulation, speculative sentiment) — the correlation may be spurious in a causal sense, purely reflecting a shared trend/bull market. - Metadata inconsistency: The axis descriptions don't clearly align with the data granularity described (BTC OHLCV vs. Ethereum address counts) — this should be verified before drawing conclusions about what's actually being compared. - Non-stationarity: Neither series appears detrended; regressing one trending series on another trending series is a classic source of spurious correlation.
5. Recommendations for Further Investigation
- Detrend or difference both series (e.g., use daily % changes instead of levels) and re-run correlation/Granger tests to check if the relationship holds after removing shared trend. - Segment by market regime (bull vs. bear phases) to see if the relationship is stable or regime-dependent. - Fit a log-log or power-law model given the apparent curvature and heteroscedasticity, which may explain variance better than the linear r²=0.739. - Clarify data provenance — confirm actual column definitions, since the current labels are contradictory and any causal narrative depends on knowing whether this is truly ETH activity vs. BTC price or something else. - Since Granger causality is absent, avoid using one series as a leading indicator for the other in trading/forecasting models; treat the correlation as descriptive/associative only.
X dataset: CryptoDataDownload – Binance BTC/USDT Daily OHLCV
Y dataset: Ethereum Historical Price Data
Part of experiment: Bitcoin - CryptoDataDownload – Binance BTC/USDT Daily OHLCV vs Ethereum Historical Price Data