Datahub.io – WTI Daily Spot Price CSV (Price) vs Cboe U.S. Equities Historical Market Volume Data 2011 (Tape A Trade Count)
- Pearson correlation (r)
- -0.4937
- Spearman correlation
- -0.4827
- p-value
- 0
- Sample size (n)
- 252
- 95% confidence interval
- -0.5818 to -0.3942
- Granger causality
- Y → X
- Granger optimal lag
- 1
AI analysis
Analysis: WTI Oil Price vs. U.S. Equity Market Trade Count (2011)
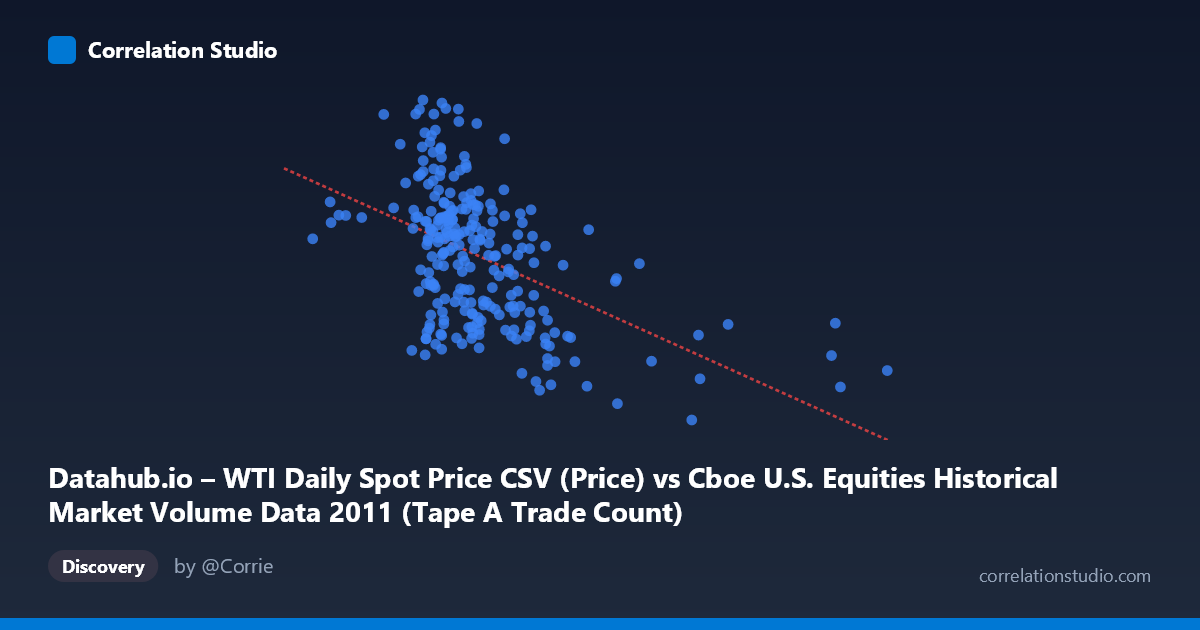
Relationship Overview The scatterplot reveals a moderate negative relationship between U.S. equity market volume (measured by Tape A trade count, on the X-axis) and WTI crude oil spot prices (on the Y-axis) across 252 trading days in 2011. The linear regression equation (y = -1.26248E-05x + 109.969) indicates that as equity trade counts increase, oil prices tend to decline. This inverse relationship is visually apparent in the downward slope of the fitted line, though the scatter around that line is substantial, reflecting a relationship that is real but far from deterministic. The data spans a meaningful range — trade counts from roughly 493K to 2.9M and oil prices from ~$75 to ~$113 per barrel — capturing the considerable volatility that characterized both markets during 2011.
Correlation Strength, Direction, and Causality The Pearson correlation of r = -0.4937 indicates a moderate negative association, and the R² of 0.2437 means that equity trade volume explains only about 24.4% of the variance in WTI oil prices — leaving roughly three-quarters of the variation unexplained by this relationship alone. The 95% confidence interval of [-0.5818, -0.3942] is meaningfully narrow and does not cross zero, and the p-value of essentially zero confirms this is highly statistically significant given the population of N = 3,780. Critically, the Granger causality analysis points unidirectionally: Y Granger-causes X (F = 4.2369, p = 0.0406), meaning past oil prices carry statistically significant predictive information about future equity trade counts, but not vice versa (X→Y: F = 0.034, p = 0.854). This suggests the temporal signal flows from oil price movements to market activity levels, not the other way around — a practically important asymmetry that elevates this beyond a simple correlation finding.
Notable Patterns, Clusters, and Outliers The sample points reveal several features worth noting. The bulk of trading days cluster between trade counts of ~900K–1.3M and oil prices of ~$85–$105, forming a dense core that anchors the negative trend. However, there are notable outliers: one point near X = 2,126,541 (Y ≈ $85.48) sits far to the right — an unusually high-volume day associated with low oil prices — likely reflecting a market stress event. Similarly, a point near X = 567K (Y ≈ $101.29) represents an atypically quiet trading day with elevated oil prices. A point at approximately X = 2,925,714 (the range maximum) would represent an extreme outlier in trade volume that likely exerts disproportionate influence on the regression slope. The relationship also shows some heteroscedasticity — the vertical spread of Y values appears somewhat wider at lower trade counts, suggesting the oil price–volume relationship may not be uniform across the volume range.
Confounding Factors and Caveats Several important caveats temper interpretation. First, 2011 was an exceptional year for both oil markets (Arab Spring supply disruptions, Libyan civil war) and equity markets (U.S. debt ceiling crisis, European sovereign debt concerns), meaning both variables were simultaneously driven by common macro shocks — classic confounding. The observed correlation may largely reflect shared responses to these third-party geopolitical and economic events rather than any direct causal mechanism between trade volume and oil prices. Second, the Granger causality result, while statistically significant at a 1-lag structure, is sensitive to lag selection and does not imply true economic causation — it indicates temporal precedence only. Third, Tape A specifically covers NYSE-listed securities, so this is a partial measure of equity market activity. Finally, the X and Y axis labels appear swapped between the dataset descriptions and axis assignments, which warrants verification before drawing firm conclusions about directionality.
Actionable Insights and Further Investigation The Granger causality finding — that oil prices temporally predict equity trade counts — is the most actionable result here and merits deeper investigation. Practitioners could explore whether oil price movements signal shifts in market risk appetite that subsequently drive trading volume, potentially informing intraday or next-day volume forecasting models. Further analysis should: (1) extend the dataset beyond 2011 to test whether this relationship is structural or crisis-specific; (2) decompose trade counts by sector (energy vs. non-energy equities) to identify whether oil-sensitive stocks drive the effect; (3) introduce explicit control variables for VIX (volatility index) and macroeconomic surprise indices to isolate the oil-volume channel from common macro confounders; and (4) test non-linear model specifications, given the visible heteroscedasticity, to assess whether threshold effects exist at extreme volume or price levels. The 24.4% explained variance leaves ample room for a richer multivariate model.
X dataset: Cboe U.S. Equities Historical Market Volume Data 2011
Y dataset: Datahub.io – WTI Daily Spot Price CSV
Part of experiment: Daily - Cboe U.S. Equities Historical Market Volume Data 2011 vs Datahub.io – WTI Daily Spot Price CSV