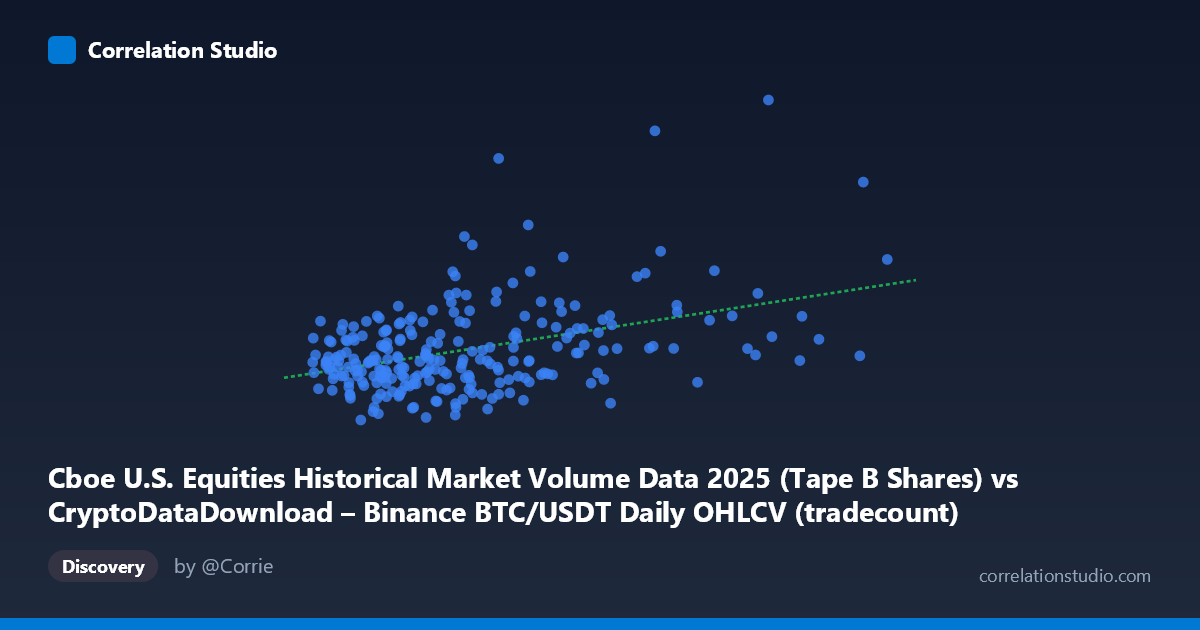
Cboe U.S. Equities Historical Market Volume Data 2025 (Tape B Shares) vs CryptoDataDownload – Binance BTC/USDT Daily OHLCV (tradecount)
- Pearson correlation (r)
- 0.4104
- Spearman correlation
- 0.3026
- p-value
- 0
- Sample size (n)
- 250
- 95% confidence interval
- 0.3017 to 0.5086
- Granger causality
- None
- Granger optimal lag
- 10
- Time coverage
- 2025-01-02 to 2025-12-31
AI analysis
Analysis: Cboe Equities Volume vs. Binance BTC/USDT Trade Count
1. Overview of the Relationship
The scatterplot displays a modest positive association between two variables that, notably, come from entirely different financial ecosystems — traditional U.S. equities volume (X-axis) and Binance BTC/USDT tradecount (Y-axis), as mislabeled/cross-mapped in the column metadata. The data cloud shows a general upward drift: as X increases, Y tends to increase as well, but the scatter is wide and the relationship is far from tight or deterministic. Most points cluster in the lower-left region (X between 2,000,000–5,000,000; Y between 100,000,000–200,000,000), with a thinning tail of higher-X observations trailing up toward the top right.
2. Strength, Direction, and Statistical Confidence
The correlation coefficient (r = 0.4104) indicates a weak-to-moderate positive linear relationship. Squaring this gives r² = 0.1684, meaning only about 16.8% of the variance in Y is explained by X — the remaining 83.2% is driven by other factors, noise, or nonlinear dynamics not captured in this simple linear model. The 95% confidence interval [0.3017, 0.5086] is reasonably tight and does not cross zero, and the p-value (1.42 × 10⁻¹¹) is highly significant, confirming that this correlation is not due to random chance in this sample. However, statistical significance should not be conflated with practical strength — the relationship is real but weak, explaining only a small fraction of the variability in the dependent variable. Critically, the Granger causality test shows no significant predictive direction in either direction (X→Y: p = 0.953; Y→X: p = 0.713), meaning that despite the contemporaneous correlation, neither variable's past values help forecast the other's future values over the tested lag structure. This strongly suggests the relationship is either coincidental, driven by a shared external factor, or purely contemporaneous rather than causal/predictive.
3. Notable Patterns and Outliers
Several points stand out with unusually high Y-values relative to their X-values (e.g., ~4,200,000 paired with Y 237,000,000), suggesting possible outlier days or volatility spikes disconnected from the general trend. There also appears to be at least one high-leverage point near X ≈ 9,800,000 that sits below the regression line, and another near X ≈ 11,800,000 (near the max of the X range) that may exert disproportionate influence on the slope estimate. The bulk of the data does not show obvious curvature suggesting a nonlinear relationship — the scatter looks fairly homoscedastic-random rather than following a clear curve, though the spread of Y increases somewhat at mid-range X values, hinting at mild heteroscedasticity.
4. Confounding Factors and Caveats
This correlation is likely spurious or indirectly mediated. Both crypto trading activity and equities market volume are influenced by common macro factors — overall market volatility, risk sentiment, major news events, holidays, and calendar effects (e.g., low volume on weekends/holidays across both markets) — which could produce correlated patterns without any direct economic link. Additionally, mismatched trading calendars (crypto trades 24/7/365; equities only trade on business days) mean that daily alignment between these series may introduce artifacts, especially around weekends when equities volume is zero/missing but crypto continues trading. The population-to-sample ratio (250 of 3,212) also means substantial data reduction occurred, and results should be checked for sampling bias.
5. Recommendations for Further Investigation
Given the lack of Granger causality and modest r², this pairing appears more like a spurious or confounded correlation than a meaningful predictive relationship. Suggested next steps: (1) test for common macro drivers (e.g., VIX, overall crypto market cap, or day-of-week effects) using multivariate regression; (2) align/filter data to trading-day equivalents only, removing weekend crypto data to avoid apples-to-oranges comparisons; (3) examine the relationship in volatility or returns space rather than raw levels, which often is more meaningful in cross-market comparisons; and (4) consider testing longer or shorter lag windows in Granger analysis, since the chosen optimal lag (10 periods) showed no significance — a different lag structure or a nonlinear causality test (e.g., transfer entropy) might reveal hidden dependencies.
X dataset: CryptoDataDownload – Binance BTC/USDT Daily OHLCV
Y dataset: Cboe U.S. Equities Historical Market Volume Data 2025
Part of experiment: Bitcoin - CryptoDataDownload – Binance BTC/USDT Daily OHLCV vs Cboe U.S. Equities Historical Market Volume Data 2025