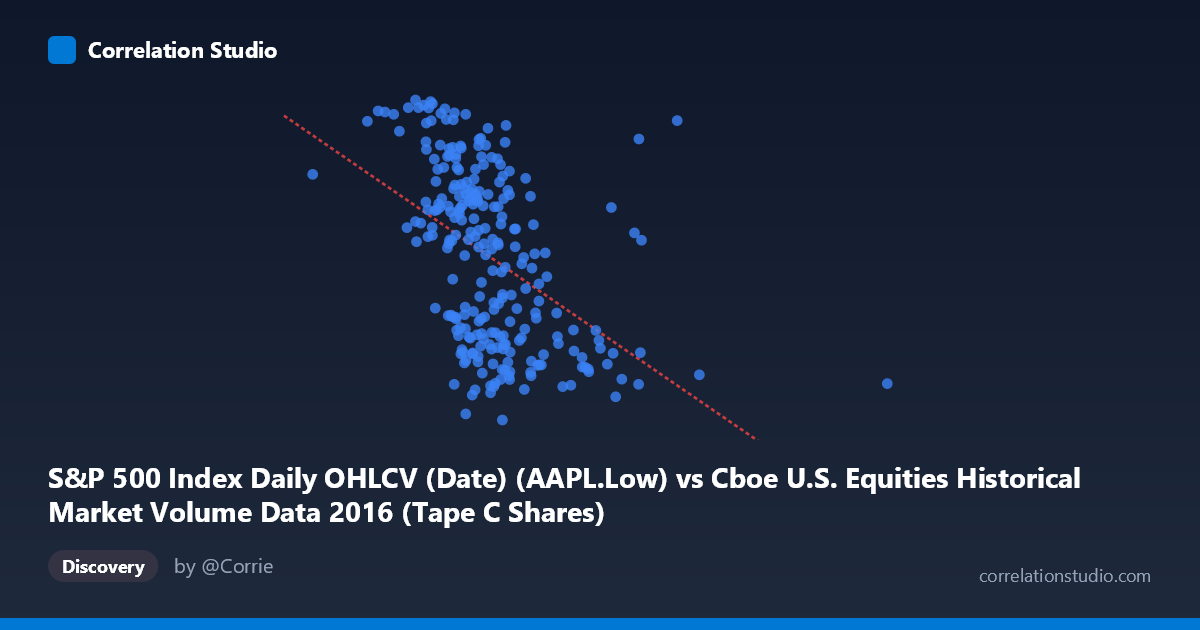
S&P 500 Index Daily OHLCV (Date) (AAPL.Low) vs Cboe U.S. Equities Historical Market Volume Data 2016 (Tape C Shares)
- Pearson correlation (r)
- -0.4627
- Spearman correlation
- -0.53
- p-value
- 0
- Sample size (n)
- 252
- 95% confidence interval
- -0.5546 to -0.3597
- Granger causality
- None
- Granger optimal lag
- 1
AI analysis
Scatterplot Analysis: AAPL Low Price vs. Cboe Tape C Share Volume (2016)
Relationship Overview The scatterplot reveals a negative relationship between Apple's daily low price (X-axis) and Cboe Tape C share volume (Y-axis) across 252 trading days in 2016. The linear regression equation (y = -1.305×10⁻⁷x + 121.04) confirms that as AAPL's low price increases, Tape C share volume tends to decline. This pattern is visually consistent with the broader dataset, though the scatter around the regression line is substantial, indicating that many other forces are simultaneously driving volume behavior. The relationship is intuitively plausible — higher equity prices can suppress share-count volume as fewer shares change hands per dollar traded — but the connection here spans two distinct datasets joined by date, which introduces important interpretive caveats.
Correlation Strength, Direction, and Predictive Value The Pearson correlation of r = -0.4627 reflects a moderate negative association, but the explanatory power is modest: R² = 0.2141 means only ~21.4% of the variance in Tape C volume is explained by AAPL's low price. Nearly 79% of daily volume fluctuations arise from factors entirely outside this model. The 95% confidence interval for r of [-0.5546, -0.3597] is meaningfully negative throughout, and the p-value of 8.88×10⁻¹⁵ confirms the relationship is highly statistically significant — this is almost certainly not a sampling artifact. However, statistical significance with this sample size (n = 252) does not imply practical or causal significance. Critically, Granger causality tests show no significant predictive direction in either direction (X→Y: F = 1.34, p = 0.248; Y→X: F = 0.82, p = 0.367), meaning neither variable meaningfully predicts the other's future values at the optimal lag. The correlation is contemporaneous and symmetric — it cannot be leveraged for temporal forecasting.
Patterns, Clusters, and Outliers The sample points reveal notable structural features. The data does not appear uniformly distributed along the X-axis; there is a concentration of AAPL low prices in the ~$105–$135 range, with sparser observations at the extremes (below ~$95 or above ~$160). Several potential outliers are visible: points with AAPL low prices near $99–$100 show unusually high Tape C volume (~116–117 units), while some observations in the $160–$175 range show relatively low volume (~92–95 units), reinforcing the negative trend at the extremes. One notable point — (138.4M, 89.47) — represents the minimum Y value in the dataset and stands out as a potential influential observation. The spread in Y values (~28 units wide) appears relatively homogeneous across the X range, suggesting no strong heteroscedasticity, though the scatter is wide enough to suggest a non-trivial noise floor.
Confounding Factors and Interpretive Caveats Several important caveats apply. First, this correlation is cross-dataset: AAPL's low price from S&P 500 OHLCV data is being paired with aggregate Cboe Tape C volume — a market-wide measure — by date alone. Any shared correlation may be driven by common macroeconomic or market-regime factors (e.g., volatility events, Federal Reserve announcements, earnings seasons) that independently move both AAPL prices and total exchange volume. Second, AAPL is itself a component of total market volume, creating a partial self-referential relationship. Third, 2016 was a distinctive year — it included Brexit (June), the U.S. presidential election (November), and significant AAPL product cycles — all of which could create episodic clusters that inflate the apparent correlation. Finally, the negative relationship between price level and share-count volume is partially mechanical (higher prices mean fewer shares per dollar of notional value), which may explain correlation without implying any economically meaningful dynamic.
Actionable Insights and Further Investigation Given the moderate but non-predictive correlation, several follow-up analyses are warranted. Controlling for market volatility (e.g., VIX) would help isolate whether the relationship persists after accounting for the dominant driver of volume spikes. Decomposing Tape C volume by notional value rather than share count would test whether the negative correlation is mechanical or behavioral. Since Granger causality was null, examining higher lags or non-linear Granger frameworks (e.g., threshold VAR) might uncover more nuanced temporal dynamics. Additionally, repeating the analysis across multiple years would determine whether this correlation is stable or 2016-specific. Practitioners should treat this correlation as a descriptive market-regime signal rather than a predictive tool — useful for characterizing market conditions in retrospect, but insufficient as a standalone trading or volume-forecasting input.
X dataset: Cboe U.S. Equities Historical Market Volume Data 2016
Y dataset: S&P 500 Index Daily OHLCV (Date)
Part of experiment: Daily - Cboe U.S. Equities Historical Market Volume Data 2016 vs S&P 500 Index Daily OHLCV (Date)