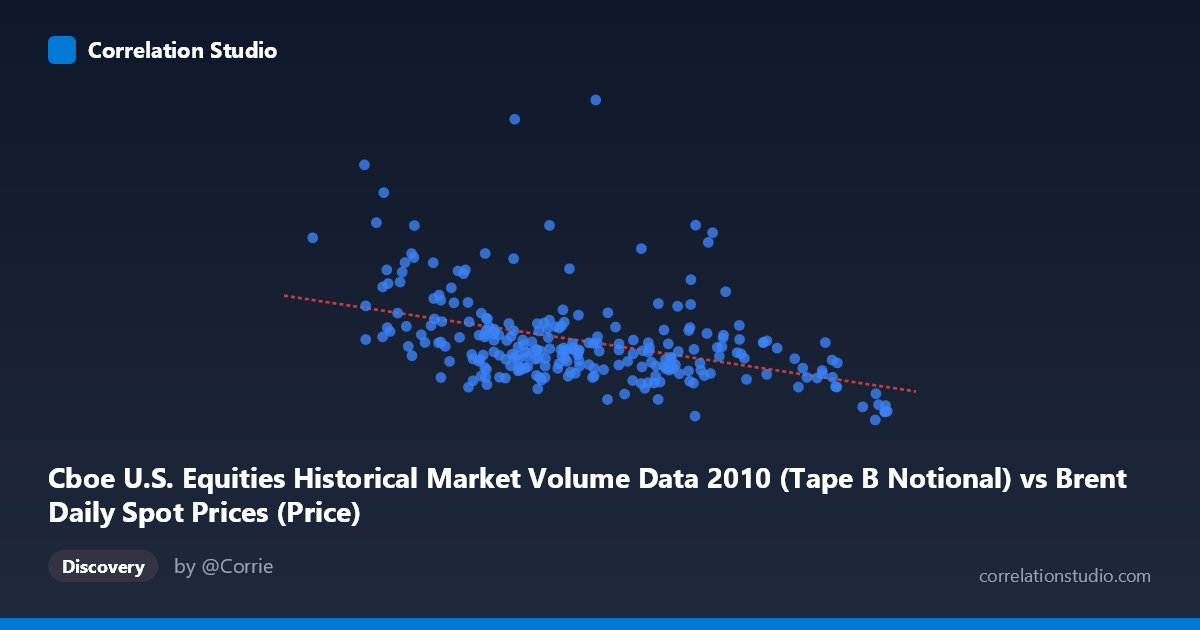
Cboe U.S. Equities Historical Market Volume Data 2010 (Tape B Notional) vs Brent Daily Spot Prices (Price)
- Pearson correlation (r)
- -0.4224
- Spearman correlation
- -0.4469
- p-value
- 0
- Sample size (n)
- 252
- 95% confidence interval
- -0.5189 to -0.3153
- Granger causality
- None
- Granger optimal lag
- 10
AI analysis
Scatterplot Analysis: Brent Crude Oil Prices vs. Cboe Tape B Notional Volume (2010)
Relationship Overview
The scatterplot reveals a negative relationship between Europe Brent crude oil spot prices (X-axis, in USD/barrel) and Cboe Tape B notional trading volume (Y-axis, in USD). As Brent crude prices rise across the observed range of roughly $67–$94/barrel, Tape B notional volume tends to decline. The linear regression equation (y = −1.477×10⁸x + 1.692×10¹⁰) quantifies this inverse slope, suggesting that each additional dollar in crude oil price is associated with approximately $147.7 million less in Tape B notional volume. However, the scatter around this regression line is considerable, and the relationship is far from deterministic, with many data points deviating substantially from the trend.
Correlation Strength and Statistical Framing
The Pearson correlation of r = −0.4224 indicates a moderate negative association, but the coefficient of determination (r² = 0.1785) is the more sobering figure: only ~17.8% of the variance in Tape B notional volume is explained by Brent crude price levels. The remaining ~82% of variation is driven by other factors entirely unrelated to crude oil pricing. The 95% confidence interval for r [−0.5189, −0.3153] is meaningfully below zero throughout, and the p-value of 2.5×10⁻¹² confirms the correlation is statistically highly significant given n = 252 paired observations drawn from a population of N = 3,302. That said, statistical significance here is partly a function of sample size and should not be conflated with practical or economic significance. Critically, the Granger causality tests show no significant predictive directionality in either direction (X→Y: F = 0.757, p = 0.670; Y→X: F = 1.120, p = 0.348), meaning neither variable reliably predicts future values of the other at the optimal 10-period lag. The correlation, while real, appears to be contemporaneous and non-causal in the temporal sense.
Notable Patterns, Clusters, and Outliers
Several features stand out visually. The bulk of observations cluster in the $73–$87/barrel range, with Tape B notional volume concentrated between roughly $3–$7 billion, forming a dense central mass around the mean. However, there are notable high-volume outliers at relatively moderate oil prices — most strikingly near X ≈ 76.5 (~$15.1B notional), X ≈ 75.1 (~$9.1B), and X ≈ 71.4 (~$8.7B) — that sit far above the regression line and exert leverage on the fit. At the lower crude price end (~$67–$73/barrel), volume is more dispersed and skewed upward, consistent with the negative slope. At the high end (~$86–$94/barrel), volume compresses noticeably toward lower values (e.g., $2.0B and $2.3B near $93–$94/barrel), supporting the negative trend, though these extreme values may reflect low-liquidity periods. The relationship also appears to have a possible non-linear or heteroscedastic character, with variance in Y decreasing as X increases — a feature the linear model does not capture.
Confounding Factors and Interpretive Caveats
This correlation almost certainly reflects shared time-series dynamics rather than a direct economic mechanism. Both variables are daily time series covering 2010, and crude oil prices trended broadly upward during parts of that year, while equity market volumes — particularly on regional exchanges like Tape B — were influenced by broader market volatility, post-financial-crisis normalization, algorithmic trading patterns, and macroeconomic news flow. A spurious correlation driven by common macroeconomic calendar effects (e.g., both variables responding inversely to market risk appetite or liquidity cycles) is a plausible explanation. Additionally, the high-volume outliers suggest episodic market events (flash crash-related activity, large institutional flows) that are unrelated to crude prices but inflate certain observations. The mislabeled dataset columns (dataset names and column descriptions appear swapped in the source metadata) also introduce minor interpretive uncertainty, though the underlying data relationships remain analyzable.
Actionable Insights and Further Investigation
Given that only ~18% of variance is explained and no Granger causality is detected, practitioners should avoid using Brent crude prices as a predictive input for Tape B notional volume in any operational or trading model. However, the statistically robust negative correlation warrants deeper investigation into whether a common latent factor — such as the VIX (equity volatility index), macroeconomic surprise indices, or USD strength — simultaneously drives crude prices up and equity trading volumes down. It would be valuable to re-examine this relationship controlling for market volatility and to investigate whether the outlier high-volume days correspond to identifiable market events (e.g., May 6, 2010 Flash Crash). A non-linear or regime-switching model may better capture the apparent heteroscedasticity. Finally, extending the analysis across multiple years (the population spans to present) could reveal whether this 2010 correlation is a stable structural feature or an artifact of that particular macro environment.
X dataset: Brent Daily Spot Prices
Y dataset: Cboe U.S. Equities Historical Market Volume Data 2010
Part of experiment: Daily - Brent Daily Spot Prices vs Cboe U.S. Equities Historical Market Volume Data 2010