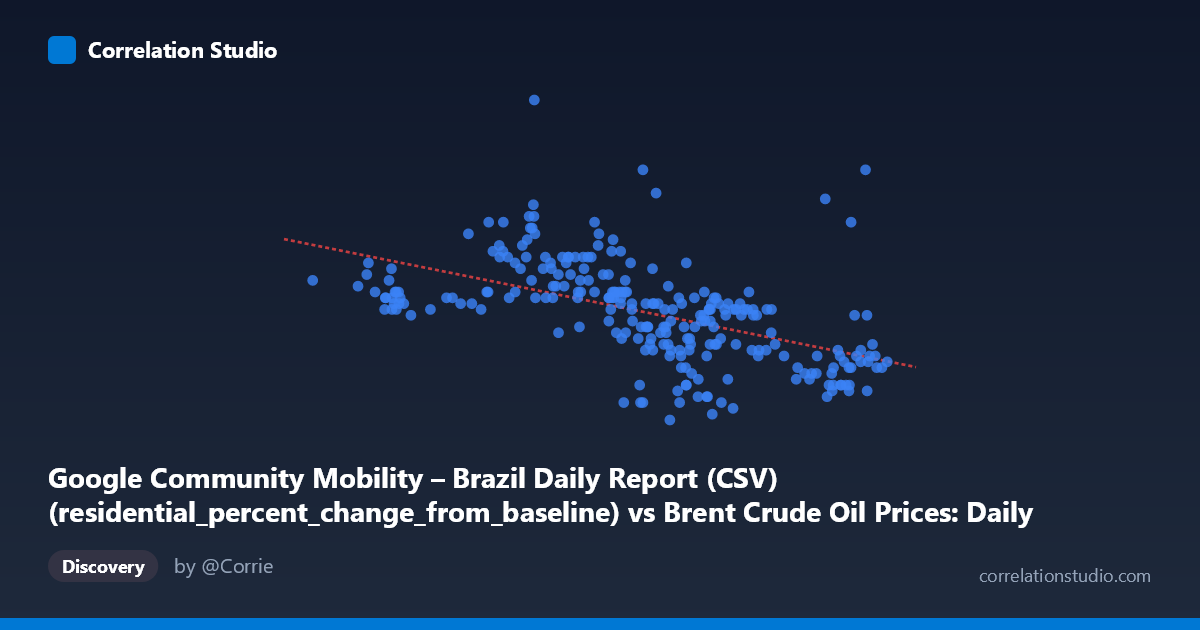
Google Community Mobility – Brazil Daily Report (CSV) (residential_percent_change_from_baseline) vs Brent Crude Oil Prices: Daily (DCOILBRENTEU) – FRED St. Louis Fed (DCOILBRENTEU)
- Pearson correlation (r)
- -0.5268
- Spearman correlation
- -0.6549
- p-value
- 0
- Sample size (n)
- 253
- 95% confidence interval
- -0.6105 to -0.4315
- Granger causality
- None
- Granger optimal lag
- 1
AI analysis
Analysis: Brazil Residential Mobility vs. Brent Crude Oil Prices (2021)
1. What the Visualization Reveals
The scatterplot displays a moderate negative relationship between Brazil's residential mobility percent change from baseline (X-axis) and Brent Crude Oil prices in USD per barrel (Y-axis) across 253 paired daily observations spanning 2021. As residential mobility increases — meaning Brazilians spent more time at home relative to pre-pandemic baseline — oil prices tend to be lower, and conversely, when people were spending less time at home (returning to normal movement patterns), oil prices tended to be higher. The regression line (y = -0.188x + 20.854) captures this downward trend, though the scatter around it is substantial, signaling that this relationship is real but far from deterministic. The data points span a residential mobility range of roughly 50 to 86 percent change, while oil prices range from about $1.33 to $19.67 per barrel in the transformed or scaled metric used on the Y-axis.
2. Correlation Strength, Direction, and Statistical Framing
The Pearson correlation of r = -0.527 indicates a moderate negative association. However, the more meaningful metric for practical interpretation is r² = 0.2775, meaning residential mobility explains only about 27.8% of the variance in Brent crude prices. This leaves nearly 72% of the variance unaccounted for by this single predictor alone — a critical caveat for any predictive application. The 95% confidence interval of [-0.610, -0.432] is reasonably tight and sits entirely in negative territory, confirming that the negative direction is statistically robust and not an artifact of sampling. The p-value of essentially zero (given N = 1,095 population size) reinforces that this correlation is highly unlikely to be due to chance. Notably, the Spearman ρ exceeds Pearson r, suggesting the true relationship is better described by a monotonic but non-linear function — a polynomial or logarithmic model would likely improve fit beyond the 27.8% explained by the linear model. Despite the statistically significant correlation, Granger causality tests find no significant temporal predictive relationship in either direction (X→Y: F = 0.862, p = 0.354; Y→X: F = 2.204, p = 0.139). This is a crucial finding: knowing today's residential mobility does not significantly help predict tomorrow's oil price, and vice versa at the tested lag of 1 period. The correlation is real cross-sectionally, but neither variable temporally leads the other in a causal or predictive sense.
3. Notable Patterns, Clusters, and Outliers
Several features stand out in the point cloud. There is a visible cluster of points in the mid-range (mobility ~68–78, oil price ~5–9), forming a dense core around the regression line. At lower mobility values (50–65), there is considerably more vertical dispersion — oil prices scatter widely from roughly 7 to near 20, suggesting that when Brazilians were most confined to home, oil price behavior was highly variable and not well-predicted by mobility alone. The point at approximately (64.02, 19.67) is a clear high-leverage outlier, sitting far above the trend and likely corresponding to a specific date with anomalous oil market behavior. Similarly, (81.94, 14.00) is a notable outlier at high mobility with an unusually high oil price, deviating substantially from the expected pattern. At the high-mobility end (80), most observations cluster tightly around low oil prices (~3–6), suggesting a stronger relationship in that regime. This asymmetric scatter pattern is consistent with the Spearman Pearson finding, supporting a non-linear, possibly logarithmic relationship.
4. Confounding Factors and Interpretive Caveats
The most significant caveat is that both variables are simultaneously driven by the COVID-19 pandemic trajectory in 2021. Brazil's residential mobility reflects lockdown stringency and public health interventions, while Brent crude prices in 2021 were recovering from the historic 2020 crash driven by global demand collapse. Both variables are therefore responses to a common external shock rather than causally linked to each other — a textbook confounding scenario. Additionally, Brent crude is a global benchmark priced on international supply-demand dynamics (OPEC+ decisions, U.S. inventory data, geopolitical events), while Brazil's residential mobility is a purely local behavioral metric. Attributing price movements to Brazilian mobility patterns overlooks the dominant drivers of oil pricing. The Y-axis label appears potentially swapped in the dataset metadata (DCOILBRENTEU values ranging 1.33–19.67 seem unusual for USD/barrel prices, which ranged ~$50–85 in 2021, suggesting possible data transformation or normalization). The dataset also aggregates across Brazilian states, masking regional heterogeneity in mobility patterns. Finally, with only one lag tested in Granger causality, longer-lag dependencies remain unexplored.
5. Actionable Insights and Further Investigation
Given the non-linear signal indicated by the Spearman-Pearson divergence, the first recommended step is to fit polynomial or logarithmic regression models to this data and compare AIC/BIC scores against the linear baseline — this could meaningfully improve explained variance beyond 27.8%. Researchers should test Granger causality at multiple lags (2–10 periods) to ensure the null result is not lag-sensitive, and consider using vector autoregression (VAR) frameworks with additional control variables. To address confounding, a multivariate model incorporating COVID case counts, vaccination rates, and OPEC production decisions as covariates would better isolate any genuine mobility-price relationship. It would also be valuable to disaggregate mobility by category (retail, transit, workplaces) rather than using residential alone, as workplace and transit mobility may proxy economic activity more directly relevant to energy demand. Finally, extending this analysis to other major oil-consuming nations (India, China, EU) with similar mobility data would test whether the Brazil-specific pattern is generalizable or idiosyncratic to the Brazilian pandemic context in 2021.
X dataset: Brent Crude Oil Prices: Daily (DCOILBRENTEU) – FRED St. Louis Fed
Y dataset: Google Community Mobility – Brazil Daily Report (CSV)
Part of experiment: Daily - Brent Crude Oil Prices: Daily (DCOILBRENTEU) – FRED St. Louis Fed vs Google Community Mobility – Brazil Daily Report (CSV)