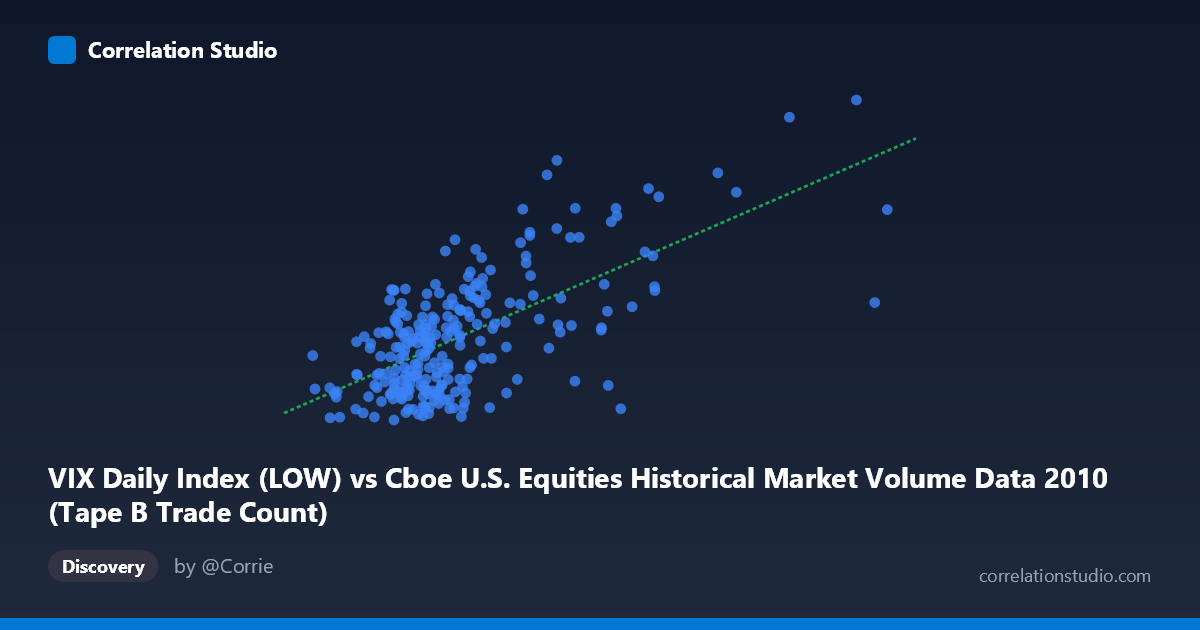
VIX Daily Index (LOW) vs Cboe U.S. Equities Historical Market Volume Data 2010 (Tape B Trade Count)
- Pearson correlation (r)
- 0.6533
- Spearman correlation
- 0.5334
- p-value
- 0
- Sample size (n)
- 252
- 95% confidence interval
- 0.5763 to 0.7189
- Granger causality
- Y → X
- Granger optimal lag
- 1
AI analysis
Analysis: VIX Low vs. Tape B Trade Count (2010)
Relationship Overview The scatterplot reveals a moderate-to-strong positive relationship between the VIX Daily Index Low values and the Cboe Tape B Trade Count across 2010 trading days. As the VIX low rises — indicating elevated baseline market fear or uncertainty — the number of Tape B trades tends to increase correspondingly. This makes intuitive sense: periods of heightened volatility historically drive greater trading activity as market participants react to uncertainty, hedge positions, and rebalance portfolios. The linear regression equation (y = 2.378×10⁻⁵x + 14.47) suggests that for every increase of roughly 42,000 units in VIX Low, Tape B trade count rises by approximately one unit, though the practical scaling of these axes warrants careful interpretation.
Correlation Strength and Statistical Significance The Pearson correlation of r = 0.6533 indicates a moderately strong positive association, but the more grounding statistic is r² = 0.4268, meaning that approximately 42.7% of the variance in Tape B Trade Count is explained by VIX Low values — leaving over 57% attributable to other factors. The 95% confidence interval of [0.5763, 0.7189] is relatively tight given the sample size of n = 252, and the p-value of effectively zero confirms this correlation is highly unlikely to be a statistical artifact. Critically, the Granger causality analysis points unidirectionally: Y Granger-causes X (F = 5.44, p = 0.0205), meaning past Tape B Trade Count values carry statistically significant predictive power for future VIX Low values, while the reverse does not hold (F = 1.96, p = 0.163). This is a notable and somewhat counterintuitive finding — trade volume activity appears to lead volatility index movements, not the other way around.
Notable Patterns, Clusters, and Outliers The sample points reveal a pronounced clustering of observations in the lower-left region of the chart, particularly where VIX Low falls between roughly 95,000–350,000 and Tape B counts cluster in the 15–23 range. This density suggests that calm, low-volatility trading days dominate the 2010 calendar, which aligns with the post-crisis stabilization period. However, there are clear high-leverage outliers in the upper-right: the point at approximately (918,659, 31.71) and (778,565, 38.95) represent exceptional days of both high volatility and elevated trade counts. The point at (445,597, 35.57) appears particularly anomalous — very high trade count relative to its VIX Low level — potentially representing a volatility spike event. The scatter also hints at heteroscedasticity: variance in trade count appears to increase as VIX Low rises, suggesting the linear model may underfit the high-volatility regime.
Confounding Factors and Caveats Several important caveats apply. First, the axis labels appear transposed relative to causal intuition — VIX data appears on the X-axis from a "Market Volume" dataset, and trade counts appear on the Y-axis from a "VIX" dataset, which likely reflects a data join artifact and should be verified before drawing conclusions. Second, 2010 was a structurally unusual year, encompassing the Flash Crash of May 6 and the European sovereign debt crisis, meaning outlier events may disproportionately drive the observed correlation. Third, Tape B specifically covers NYSE American and regional exchange securities, so the trade count reflects a subset of total market activity and may behave differently than aggregate volume measures. Finally, the Granger causality result — while statistically significant at a 1-period lag — does not imply economic causation; the effect could reflect shared sensitivity to a common latent driver such as news flow or institutional order routing patterns.
Actionable Insights and Further Investigation The Granger causality finding that trade count predicts future VIX levels deserves serious follow-up. Analysts could investigate whether Tape B trade count serves as a leading indicator of volatility regime shifts, potentially useful in short-term volatility forecasting models. It would be worthwhile to test this relationship across multiple years (2008–2020) to assess whether the correlation and causal direction are stable or crisis-dependent. Given the apparent heteroscedasticity, fitting a log-linear or quantile regression model may better capture the relationship across volatility regimes. Additionally, decomposing the unexplained 57% of variance by incorporating factors such as options expiration calendars, macroeconomic announcement days, and cross-asset volatility measures (e.g., MOVE index) could substantially improve predictive power and clarify the mechanism underlying this relationship.
X dataset: Cboe U.S. Equities Historical Market Volume Data 2010
Y dataset: VIX Daily Index
Part of experiment: Daily - Cboe U.S. Equities Historical Market Volume Data 2010 vs VIX Daily Index