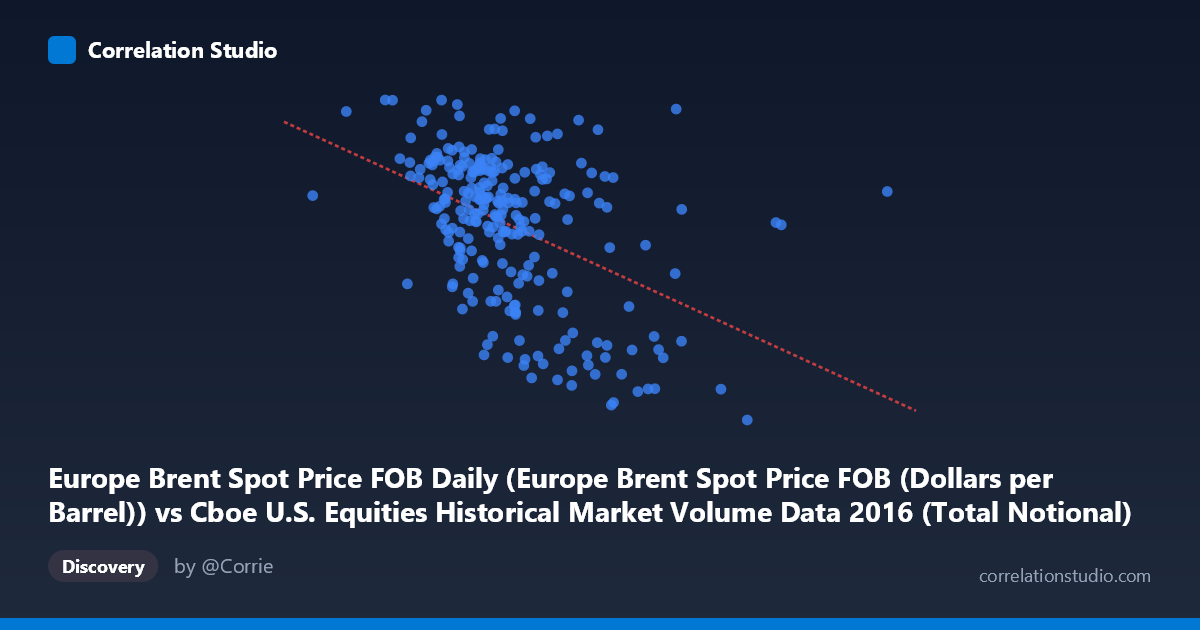
Europe Brent Spot Price FOB Daily (Europe Brent Spot Price FOB (Dollars per Barrel)) vs Cboe U.S. Equities Historical Market Volume Data 2016 (Total Notional)
- Pearson correlation (r)
- -0.4521
- Spearman correlation
- -0.4455
- p-value
- 0
- Sample size (n)
- 251
- 95% confidence interval
- -0.5454 to -0.3478
- Granger causality
- None
- Granger optimal lag
- 1
AI analysis
Analysis: Europe Brent Spot Price vs. U.S. Equities Total Notional Volume (2016)
Relationship Overview The scatterplot reveals a moderate negative relationship between Europe Brent crude oil spot prices (X-axis, in dollars per barrel) and U.S. equities total notional trading volume (Y-axis). As Brent crude prices increase, total notional volume in U.S. equity markets tends to decline, and vice versa. The linear regression equation (y = -7.13×10⁻¹⁰x + 57.23) confirms this inverse relationship, though the scatter around the regression line is substantial, indicating that crude oil price alone is far from a complete predictor of equity market volume. This pattern may reflect broader macroeconomic dynamics where periods of oil price stress coincide with shifts in market activity, though the directionality of that mechanism is not straightforward.
Correlation Strength and Statistical Significance The Pearson correlation of r = -0.4521 represents a moderate negative association, but the variance explained is modest: R² = 0.2044, meaning only about 20.4% of the variance in U.S. equities notional volume is attributable to Brent crude prices. Roughly 80% of volume variability is driven by other factors entirely. The 95% confidence interval for r of [-0.5454, -0.3478] is comfortably negative and does not include zero, and the p-value of 4.75×10⁻¹⁴ is highly significant given n = 251 paired observations drawn from a population of N = 3,622 — so the negative correlation is statistically robust, not a sampling artifact. However, statistical significance should not be conflated with practical or causal significance. Critically, the Granger causality tests find no significant predictive direction in either direction (X→Y: F = 0.41, p = 0.52; Y→X: F = 0.20, p = 0.65), meaning that knowing today's Brent price does not meaningfully improve forecasts of tomorrow's equity volume, and vice versa. The relationship appears contemporaneous rather than temporally predictive, limiting its utility for trading or forecasting applications.
Notable Patterns, Clusters, and Outliers The scatterplot exhibits several visually distinct features. There is a dense cluster of points concentrated in the X range of roughly 14–22 billion (notional) with Y values between ~40–54 barrels per dollar, suggesting that for most "normal" trading days in 2016, both variables occupied relatively stable ranges. However, a notable tail of points extends toward higher X values (above 23–25 billion) with markedly lower Y values (below 35), pulling the regression line downward and driving much of the observed correlation. The point near (32.8B, 26.01) — representing the lowest Brent price observation — stands out as a clear high-leverage outlier at the extreme right of the distribution, and similarly (25.1B, 27.59) and (24.1B, 33.01) form a sparse low-Y cluster. At the other end, points like (13.96B, 53.01) and (18.18B, 52.35) anchor the upper-left region. The relationship may therefore be driven disproportionately by a relatively small number of extreme-volume days, and the true relationship within the core cluster appears weaker and noisier than the overall r suggests.
Confounding Factors and Caveats Several important caveats apply. First, 2016 was a particularly dynamic year for oil markets, spanning the continuation of the 2014–2016 oil price downturn, OPEC's November production cut agreement, and significant macroeconomic uncertainty — meaning this dataset captures a specific regime that may not generalize. Second, high equity market volume is often associated with volatility and uncertainty (e.g., VIX spikes, macro events), which can be independently triggered by oil price shocks, making the correlation a potential artifact of shared sensitivity to a third driver such as macro risk sentiment or the U.S. dollar strength rather than a direct oil-equity volume mechanism. Third, the axis labels appear swapped in the dataset metadata (the "X" column is labeled from the Cboe dataset and "Y" from the Brent dataset), which warrants verification before drawing directional conclusions. Finally, the optimal Granger lag of only 1 period may be too short; longer lags or VAR models might reveal delayed relationships not captured here.
Actionable Insights and Further Investigation Despite the lack of Granger causality, the contemporaneous correlation is real and worth exploring further. Analysts should consider controlling for VIX or broad market volatility indices to test whether the oil-volume relationship persists after accounting for general risk-off/risk-on dynamics. It would also be valuable to segment the data by sub-period (e.g., pre- and post-OPEC cut in November 2016) to test for structural breaks in the relationship. Investigating whether the outlier high-volume days correspond to specific macro events (OPEC announcements, Fed decisions, Brexit aftermath) could clarify whether the correlation is mechanistic or coincidental. For practitioners, the absence of Granger causality suggests that Brent prices should not be used as a leading indicator for equity volume in short-term trading models, but the contemporaneous relationship could still inform same-day risk or liquidity models that incorporate cross-asset signals.
X dataset: Cboe U.S. Equities Historical Market Volume Data 2016
Y dataset: Europe Brent Spot Price FOB Daily
Part of experiment: Daily - Cboe U.S. Equities Historical Market Volume Data 2016 vs Europe Brent Spot Price FOB Daily