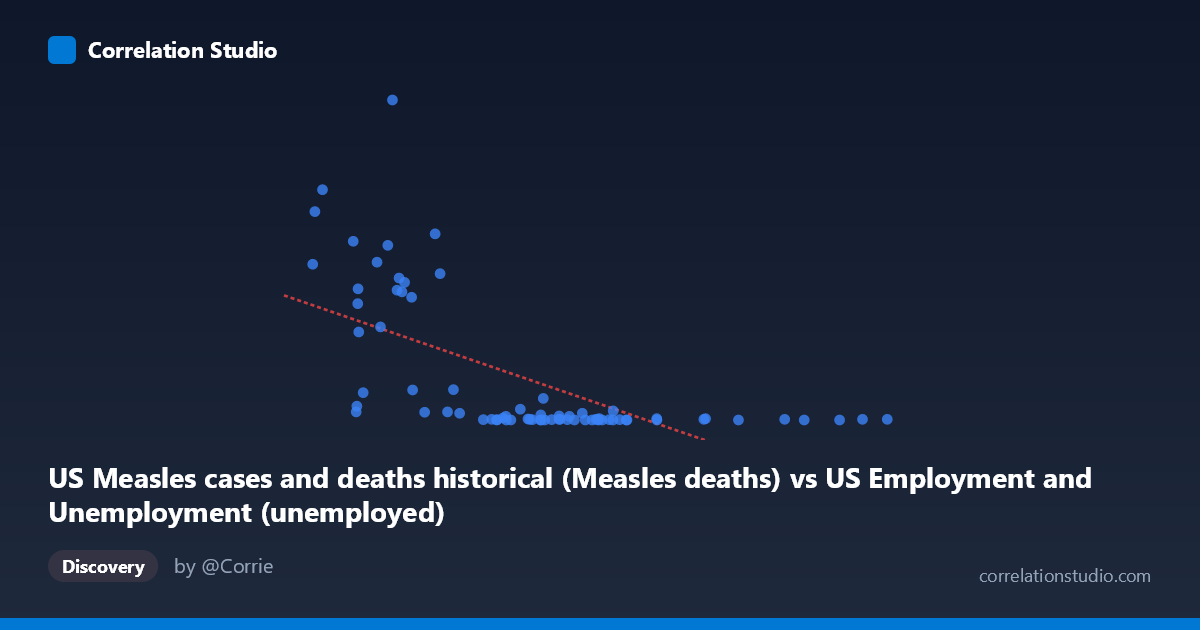
US Measles cases and deaths historical (Measles deaths) vs US Employment and Unemployment (unemployed)
- Pearson correlation (r)
- -0.6318
- Spearman correlation
- -0.721
- p-value
- 0
- Sample size (n)
- 74
- 95% confidence interval
- -0.7518 to -0.4713
- Granger causality
- None
- Granger optimal lag
- 10
AI analysis
Analysis: US Measles Deaths vs. Unemployment
Overview of the Relationship
The scatterplot reveals a negative correlation between US measles deaths (X-axis) and the number of unemployed persons (Y-axis) across an annual time series spanning 1949–2022. As measles deaths decrease over time — reflecting the dramatic public health success of vaccination programs — unemployment figures tend to be higher in absolute terms. The linear regression equation (y = -0.0451x + 423.12) quantifies this inverse trend, but the relationship is clearly not linear across the full range: the data clusters heavily near zero on the X-axis (very few measles deaths in the modern era) while Y values span a wide range, suggesting that time itself is the underlying driver shaping both variables independently.
Correlation Strength and Statistical Significance
The Pearson correlation of r = -0.63 indicates a moderate-to-strong negative association, and the R² of 0.399 means approximately 40% of the variance in unemployment is statistically "explained" by measles deaths — a figure that sounds meaningful in isolation but is almost certainly spurious (see caveats below). The 95% confidence interval of [-0.75, -0.47] is entirely negative and does not cross zero, reinforcing that the direction of association is consistent. The p-value of 1.58 × 10⁻⁹ confirms the result is highly statistically significant. However, crucially, the Granger causality test finds no significant predictive direction in either direction (X→Y: p = 0.885; Y→X: p = 0.138), meaning measles deaths do not temporally predict unemployment, nor vice versa. This is a critical finding: statistical correlation exists, but there is zero evidence of predictive or causal temporal linkage.
Notable Patterns, Clusters, and Outliers
The scatterplot exhibits a pronounced L-shaped or hyperbolic structure rather than a clean linear scatter. The bulk of observations cluster tightly near X ≈ 0–2,000 deaths and Y ≈ 0–100 unemployed (in whatever units apply), reflecting the post-vaccination modern era. A distinct upper-left cluster contains high-Y outliers — most notably (3,637, 949), (2,055, 683), (1,883, 618), and (4,602, 552) — representing early-era data points when measles deaths were still elevated and unemployment was also high (likely 1940s–1960s). Points like (10,678, 2) and (13,747, 0) anchor the right side with near-zero unemployment, likely pre-1960 periods when measles was still common but unemployment was structurally low. This non-linearity suggests a threshold effect rather than a continuous linear relationship.
Confounding Factors and Caveats
This correlation is a textbook example of a spurious time-series correlation driven by a shared temporal trend. Both variables are strongly time-dependent: measles deaths fell precipitously after the 1963 vaccine introduction and approach zero by the 1980s, while unemployment fluctuates with business cycles over the same 70+ year period. The apparent correlation is almost entirely an artifact of secular trends over time — both series change dramatically across decades, creating mathematical co-movement that carries no causal meaning. Additional confounders include population growth (affecting absolute unemployment counts), changes in labor force participation measurement, and the fact that measles eradication is driven by public health policy entirely orthogonal to economic conditions. The mismatch in dataset labeling (X-axis drawn from an employment dataset, Y-axis from a measles dataset) also warrants careful data provenance verification.
Actionable Insights and Further Investigation
The actionable takeaway here is methodological: detrend both time series before computing correlations. Using first-differences, log-differencing, or a regression-on-time residuals approach would likely collapse the r value toward zero, confirming the spurious nature of this relationship. Investigators should also apply cointegration tests (e.g., Engle-Granger) to formally assess whether any long-run relationship exists beyond shared trending. If the research goal is to understand unemployment drivers, substituting measles deaths with contemporaneous public health expenditure, workforce health metrics, or epidemic-period indicators (e.g., COVID-19) would yield more theoretically grounded hypotheses. The Granger causality result already provides a clear signal: this correlation should not be interpreted as meaningful for policy or prediction.
X dataset: US Employment and Unemployment
Y dataset: US Measles cases and deaths historical
Part of experiment: Yearly - US Employment and Unemployment vs US Measles cases and deaths historical