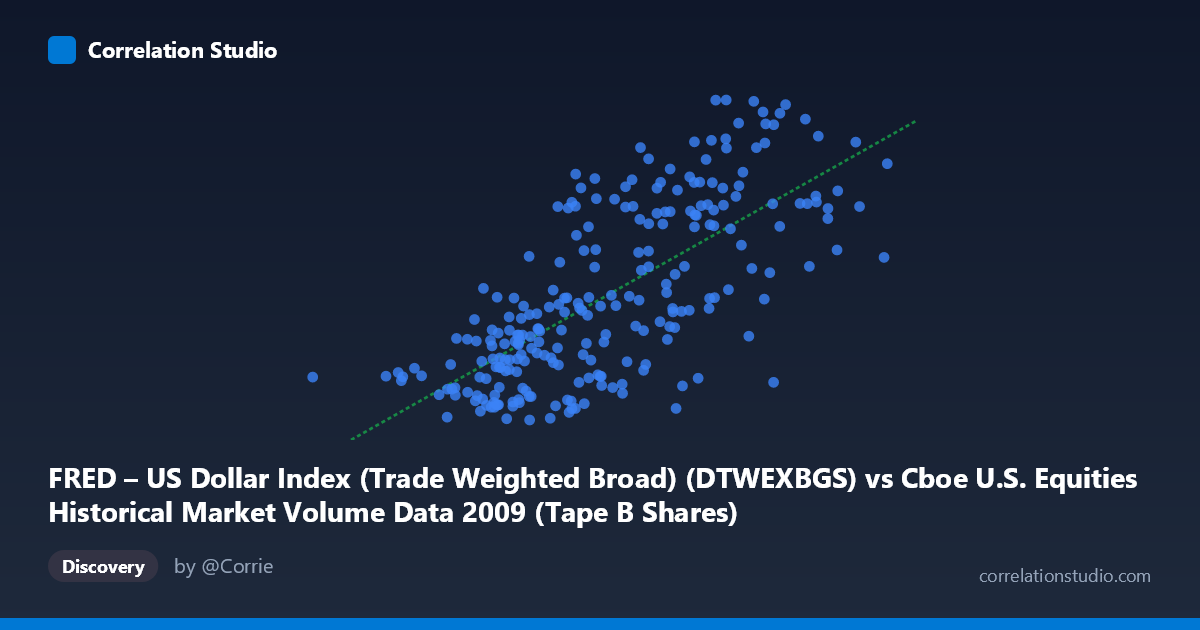
FRED – US Dollar Index (Trade Weighted Broad) (DTWEXBGS) vs Cboe U.S. Equities Historical Market Volume Data 2009 (Tape B Shares)
- Pearson correlation (r)
- 0.7133
- Spearman correlation
- 0.7125
- p-value
- 0
- Sample size (n)
- 248
- 95% confidence interval
- 0.6462 to 0.7695
- Granger causality
- None
- Granger optimal lag
- 1
AI analysis
Scatterplot Analysis: US Dollar Index vs. Cboe Tape B Shares (2009)
Relationship Overview The scatterplot reveals a positive linear relationship between the US Dollar Index (Trade Weighted Broad) and Cboe Tape B share volume for 2009. As the dollar index increases, Tape B share volumes tend to rise correspondingly. The linear regression equation (y = 6.94×10⁻⁸x + 86.51) confirms this upward slope, suggesting that higher notional trading values on US equities exchanges are associated with a stronger dollar. The relationship appears moderately consistent across the data range, though meaningful dispersion around the regression line is visible throughout, indicating the relationship is real but far from deterministic.
Correlation Strength and Statistical Significance With r = 0.713, this is a moderately strong positive correlation. The r² of 0.509 means approximately 51% of the variance in Tape B share volume is explained by variation in the dollar index — a substantial but incomplete explanation, leaving roughly half the variance attributable to other factors. The 95% confidence interval [0.646, 0.770] is relatively tight and entirely positive, reinforcing confidence that the true population correlation is meaningfully above zero. The p-value of effectively zero, combined with n=248 observations drawn from a population of N=3,232, confirms this correlation is highly statistically significant and not a sampling artifact. However, despite this statistical strength, the Granger causality results tell a notably different story: neither direction (X→Y: F=0.018, p=0.894; Y→X: F=0.281, p=0.596) approaches significance, meaning neither variable temporally predicts the other at a one-period lag. The correlation reflects co-movement, not a lead-lag predictive relationship.
Notable Patterns, Clusters, and Outliers The data exhibits several visible features worth noting. There is a denser cluster of observations in the mid-range (X: ~100M–175M; Y: ~91–101), consistent with the mean values and suggesting most trading days fell within a relatively stable regime. At higher X values (200M), the scatter widens and Y values climb toward the 103–106 range, suggesting elevated volume days disproportionately coincide with a stronger dollar. A few potential outliers are visible: the point near (33.8M, 92.87) represents an unusually low-volume day that sits somewhat isolated at the far left. Similarly, the point near (255.8M, 103.0) anchors the upper right. The lower-left boundary also shows a band of low-Y values (~90.8–92) across a range of X values, hinting at a possible floor effect in the dollar index during early 2009 stress periods.
Confounding Factors and Caveats Several important caveats apply. First, 2009 was an extraordinary year — spanning the trough of the Global Financial Crisis (March 2009) and a dramatic equity market recovery — meaning this correlation is heavily influenced by a single macro regime shift rather than representative equilibrium dynamics. Both variables likely co-moved in response to a common third factor: risk sentiment or systemic stress. When risk aversion peaked, trading volumes spiked and dollar demand surged simultaneously; as risk appetite recovered, both normalized together. Second, Tape B specifically covers regional exchange listings, which may introduce idiosyncratic liquidity patterns not representative of broader market volume. Third, the absence of Granger causality strongly cautions against any interpretation of directionality — this is a coincident relationship driven by shared macro drivers, not a mechanistic link. Temporal autocorrelation in daily financial data also risks inflating apparent significance.
Actionable Insights and Further Investigation Despite the non-causal finding, the co-movement strength (r²≈0.51) is practically significant for risk monitoring dashboards — days with unusually high Tape B volume may serve as a coincident signal for dollar strength episodes, useful for FX-equity cross-asset positioning. To deepen understanding, analysts should: (1) decompose the time series into pre- and post-March 2009 subperiods to test whether the correlation is regime-dependent; (2) introduce VIX or credit spread data as explicit controls to test the risk-sentiment confound hypothesis; (3) extend to multiple years to determine whether this relationship persists outside crisis conditions; (4) test longer Granger lags beyond 1 period, as the relationship may operate over weekly rather than daily horizons; and (5) compare Tape B results against Tape A and Tape C volumes to assess whether this pattern is exchange-specific or market-wide.
X dataset: Cboe U.S. Equities Historical Market Volume Data 2009
Y dataset: FRED – US Dollar Index (Trade Weighted Broad)
Part of experiment: Daily - Cboe U.S. Equities Historical Market Volume Data 2009 vs FRED – US Dollar Index (Trade Weighted Broad)