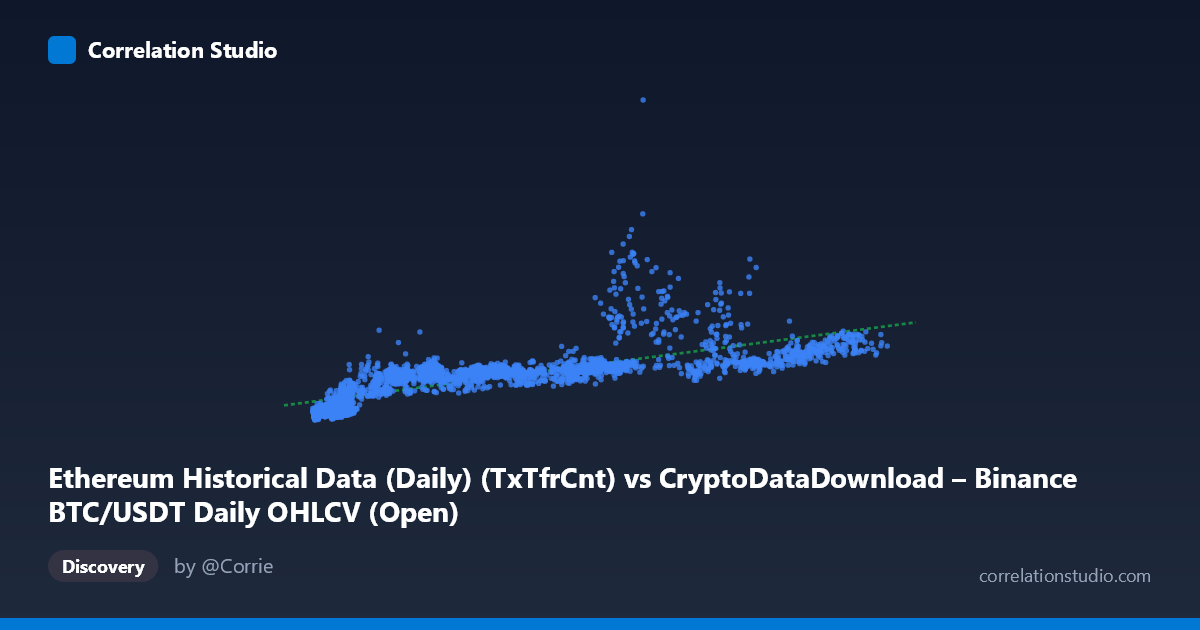
Ethereum Historical Data (Daily) (TxTfrCnt) vs CryptoDataDownload – Binance BTC/USDT Daily OHLCV (Open)
- Pearson correlation (r)
- 0.7561
- Spearman correlation
- 0.9038
- p-value
- 0
- Sample size (n)
- 3191
- 95% confidence interval
- 0.7409 to 0.7706
- Granger causality
- None
- Granger optimal lag
- 10
- Time coverage
- 2017-08-17 to 2026-05-20
AI analysis
Analysis: Ethereum Transaction Count vs. Bitcoin Opening Price
1. Relationship Overview
The scatterplot reveals a moderately strong positive association between Ethereum daily transaction count (X) and Bitcoin's daily opening price (Y). As ETH network activity increases, BTC opening prices tend to rise as well, though the relationship shows clear signs of non-linearity — the data appears to fan out and curve rather than follow a tight linear band, particularly at higher X values where Y shows increasing dispersion.
2. Strength, Direction, and Statistical Confidence
The Pearson correlation (r = 0.756) indicates a moderately strong positive relationship, but the r² of 0.572 tells the more important story: only 57% of the variance in Bitcoin's price is explained by Ethereum transaction counts, leaving 43% attributable to other factors. The tight 95% confidence interval [0.741, 0.771] combined with p ≈ 0 confirms this correlation is highly statistically reliable given the large sample (n=3,191) — we can be confident the true population correlation is meaningfully positive, not a sampling artifact.
However, the Granger causality results are critical: neither direction (X→Y or Y→X) shows significant predictive power (p = 0.51 and p = 0.55, both far above 0.05). This means that despite the contemporaneous correlation, neither variable's past values help forecast the other's future values at the tested lag structure (10 periods). This is an important distinction — correlation without Granger causality suggests both series may be driven by a common external factor (e.g., overall crypto market sentiment, macro liquidity conditions) rather than one directly influencing the other.
3. Notable Patterns and Outliers
Several features stand out in the sample data: - Heteroscedasticity: Variance in Y increases substantially as X grows — at low X (~4,000-10,000), Y clusters tightly in the 200,000-650,000 range, while at similar X values elsewhere, Y can reach 1,800,000+ (e.g., X=67,643→Y=1,815,531 vs. X=68,113→Y=2,698,591), indicating instability rather than a clean linear scaling. - A visible outlier: (68,113.92, 2,698,591) sits well above the trend line, suggesting a period of price spike disconnected from proportional transaction growth. - Possible curve/plateau: High X values (100,000+) don't show proportionally higher Y compared to the mid-range, hinting at a logarithmic or saturating relationship rather than pure linearity — consistent with the note that Spearman ρ exceeds Pearson r.
4. Confounding Factors and Caveats
This comparison mixes two different assets and networks — Ethereum's on-chain activity against Bitcoin's exchange price — so any relationship is indirect, likely mediated by shared crypto-market macro drivers (overall bull/bear cycles, regulatory news, institutional flows, or general risk appetite across digital assets). Both series likely share strong trends and volatility clustering over the 2017-2026 window, which can inflate simple correlation coefficients even without a causal or mechanistic link (spurious correlation from co-trending time series). Additionally, using BTC's opening price introduces potential timing/lag mismatches with ETH's daily aggregated transaction counts.
5. Recommendations for Further Investigation
- Test non-linear models: Given the Spearman/Pearson divergence, fit a log-log or polynomial regression — a log transform of X (transaction count) may linearize the relationship and improve fit. - Detrend and test stationarity: Since Granger causality was insignificant, check if both series are non-stationary (unit root tests); if so, analyze first differences or returns rather than levels, and consider cointegration testing instead of raw Granger causality. - Introduce a common third variable: Explore whether a shared factor (e.g., total crypto market cap, stablecoin supply, or on-chain gas fees) explains both series better than they explain each other. - Segment by market regime: Split data into bull/bear/sideways periods to see if the correlation strength or slope changes across market cycles, which could reveal regime-dependent relationships obscured in the pooled analysis.
X dataset: CryptoDataDownload – Binance BTC/USDT Daily OHLCV
Y dataset: Ethereum Historical Data (Daily)
Part of experiment: Bitcoin - CryptoDataDownload – Binance BTC/USDT Daily OHLCV vs Ethereum Historical Data (Daily)