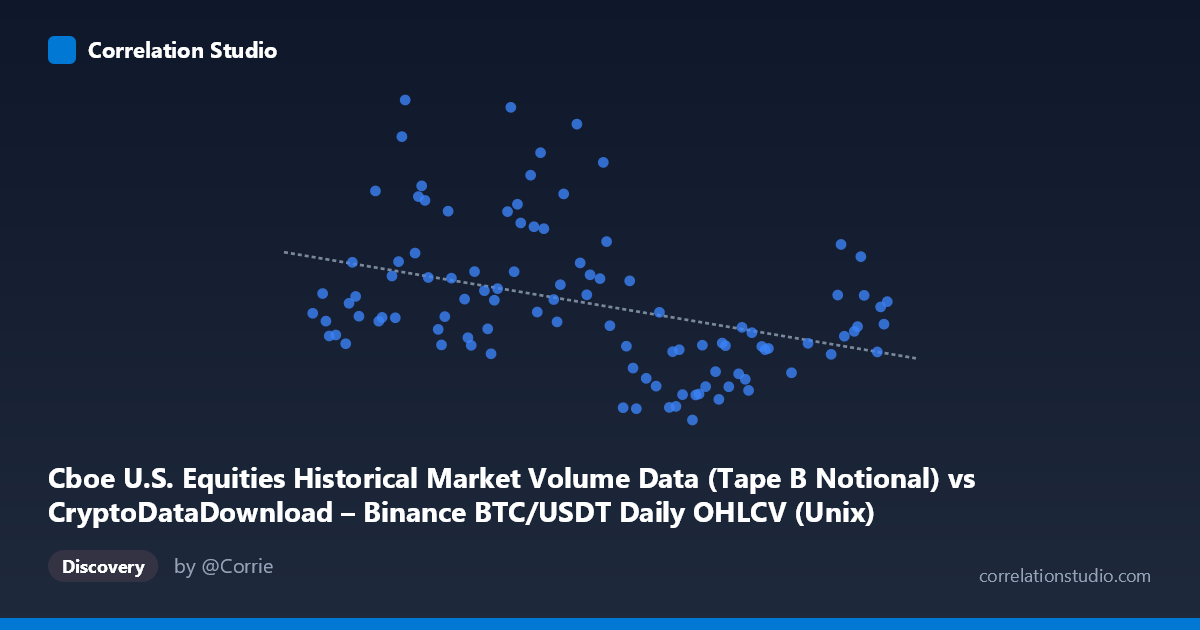
Cboe U.S. Equities Historical Market Volume Data (Tape B Notional) vs CryptoDataDownload – Binance BTC/USDT Daily OHLCV (Unix)
- Pearson correlation (r)
- -0.3852
- Spearman correlation
- -0.4432
- p-value
- 0.000054
- Sample size (n)
- 104
- 95% confidence interval
- -0.5379 to -0.2081
- Granger causality
- None
- Granger optimal lag
- 10
- Time coverage
- 2026-01-02 to 2026-06-25
- Recomputed on refreshed data
- 2026-10-24 (r was -0.3852)
AI analysis
Analysis of Cboe Equity Volume vs. BTC/USDT Volume Relationship
1. Overview of the Relationship
The scatterplot depicts 90 paired daily observations spanning early January to late May 2026, plotting Cboe U.S. equities notional volume (Tape B) against Binance BTC/USDT trading volume. The data reveals a moderate negative linear trend — as one variable increases, the other tends to decrease, though with substantial scatter around the regression line. The relationship is far from a tight linear fit; points are distributed in a diffuse cloud rather than hugging the trend line, suggesting the underlying relationship is more complex or noisy than simple linear correlation captures.
2. Strength, Direction, and Statistical Confidence
The correlation coefficient (r = -0.4527) indicates a moderate negative relationship, with r² = 0.2049 meaning only about 20.5% of the variance in Y is statistically explained by X — leaving nearly 80% attributable to other factors, noise, or nonlinear dynamics. The 95% confidence interval [-0.6032, -0.2710] is reasonably tight and entirely negative, and the p-value (7.48E-06) is highly significant, giving strong statistical confidence that a real (non-zero) negative association exists in this sample — this is not a fluke of small-sample noise. However, statistical significance should not be conflated with practical strength: an r² of ~0.20 means this relationship alone has limited predictive power. Critically, the Granger causality tests show no significant predictive direction in either direction (X→Y: p=0.085; Y→X: p=0.870) at the optimal 10-period lag, indicating that despite the contemporaneous negative correlation, neither series reliably helps forecast future values of the other. This suggests the correlation may reflect a shared external driver or coincidental co-movement rather than a causal lead-lag relationship.
3. Notable Patterns and Features
Examining the sample points, there appear to be distinct temporal regimes: an early cluster (late Jan–early Feb, X≈1769–1772B) with high Y values often exceeding 15–20 billion, contrasted with a later cluster (mid-March onward, X≈1776–1779B) where Y values compress into a lower band of roughly 7–11 billion. This suggests the negative correlation may be driven largely by a regime shift or trend over time rather than a continuous functional relationship — i.e., BTC volume was elevated early in the period and Cboe volume proxy was declining, creating an apparent negative slope that could be an artifact of two independent trends rather than genuine inverse dependence. No extreme single-point outliers dominate the fit, but the wide vertical spread at any given X value (e.g., multiple Y values from 7B to 17B clustered around similar X readings in the 1770–1772 range) confirms substantial unexplained variance.
4. Confounding Factors and Caveats
Several caveats merit attention: (1) both series are time-ordered daily data, making them susceptible to autocorrelation and trending behavior that can produce spurious correlations unrelated to any real economic linkage; (2) the mismatched dataset descriptions (X-axis labeled as Cboe volume but sourced from a Binance OHLCV file, and vice versa for Y) suggest possible label/column swapping in the metadata, which should be verified before drawing economic conclusions; (3) macro factors like overall market volatility, regulatory news, or seasonal trading patterns could simultaneously drive both crypto and equity volumes without one causing the other; (4) with n=90 from a population of 1,980, this is a small subsample (~4.5%) that may not capture the full distributional behavior of the complete dataset.
5. Recommendations for Further Investigation
Given the lack of Granger causality despite significant contemporaneous correlation, analysts should: (a) test for cointegration or shared stochastic trends rather than relying on simple correlation, since both series may be non-stationary; (b) de-trend or difference the series before re-testing correlation to rule out spurious trend-driven association; (c) investigate common macro drivers (e.g., VIX, interest rate announcements, major crypto regulatory events) that could jointly influence both volumes; (d) verify data labeling/source integrity given the apparent column-description mismatch; and (e) extend the sample window and test subperiods separately (early vs. late regime) to determine if the negative correlation is stable or an artifact of the two-cluster pattern observed. Given r² of only ~20% and no predictive causality, this relationship alone should not be used for forecasting one series from the other.
X dataset: CryptoDataDownload – Binance BTC/USDT Daily OHLCV
Y dataset: Cboe U.S. Equities Historical Market Volume Data
Part of experiment: Bitcoin - CryptoDataDownload – Binance BTC/USDT Daily OHLCV vs Cboe U.S. Equities Historical Market Volume Data