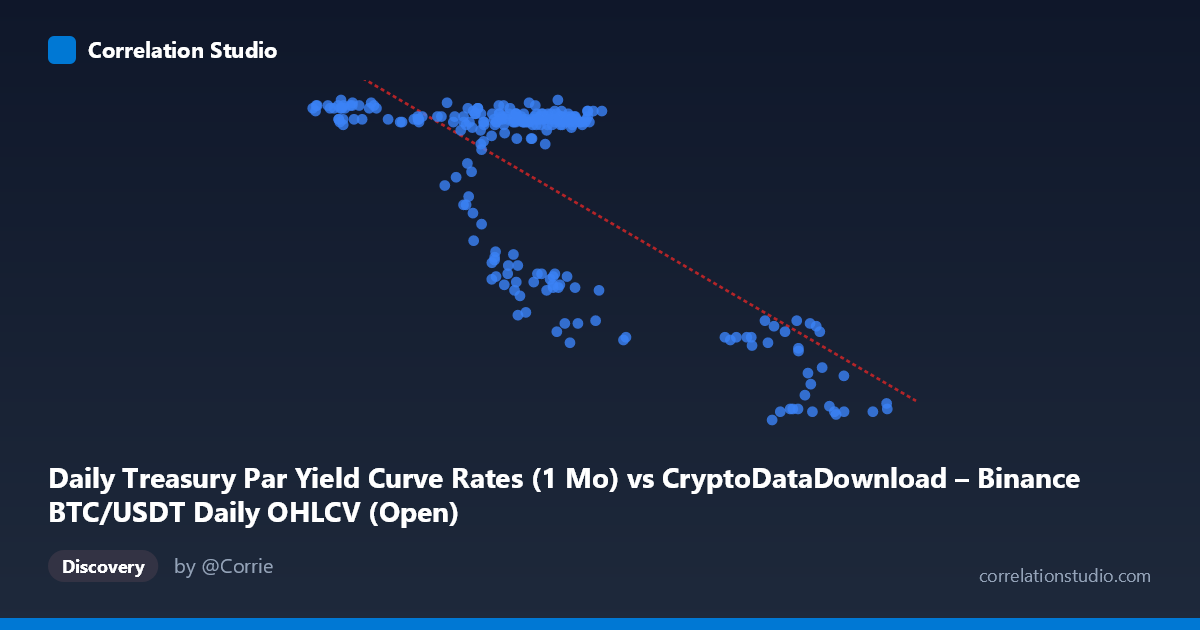
Daily Treasury Par Yield Curve Rates (1 Mo) vs CryptoDataDownload – Binance BTC/USDT Daily OHLCV (Open)
- Pearson correlation (r)
- -0.7437
- Spearman correlation
- -0.535
- p-value
- 0
- Sample size (n)
- 250
- 95% confidence interval
- -0.7945 to -0.6826
- Granger causality
- None
- Granger optimal lag
- 1
AI analysis
Analysis: Treasury Yield vs. BTC/USDT Price Relationship
Note on axis labeling: The metadata appears swapped — the values shown (4.40–5.56) are clearly the Treasury 1-Month yield (%), while the 39,568–106,133 range is the BTC/USDT price. The analysis below treats X = BTC price and Y = 1-Mo Treasury yield accordingly.
1. What the Visualization Reveals
The scatterplot shows a clear negative, non-linear relationship. At lower BTC prices (~$40,000–65,000), yield values cluster tightly in a high band (5.4–5.55%), indicating a stable-rate regime. Once BTC price rises above roughly $65,000–70,000, yields drop sharply and continue declining as price increases further, reaching ~4.4% near $100,000+. Rather than a smooth linear decay, the data resembles two distinct regimes connected by a steep transition zone — consistent with a step-like or threshold relationship rather than a proportional one.
2. Strength, Direction, and Statistical Confidence
The correlation coefficient (r = -0.74) indicates a strong negative linear relationship, with R² = 0.553 meaning roughly 55% of the variance in Treasury yields is statistically associated with BTC price movement. The 95% CI [-0.79, -0.68] is tight and the p-value ≈ 0, confirming this relationship is highly unlikely to be due to chance in this sample. However, statistical significance should not be conflated with causal mechanism: the Granger causality tests show no significant predictive direction in either direction (BTC→Yield: p=0.38; Yield→BTC: p=0.72). This means neither series meaningfully helps forecast the other's future values based on past values — the correlation is likely contemporaneous/coincidental rather than reflecting a lead-lag causal dynamic.
3. Notable Patterns and Outliers
- Two-cluster structure: A dense cluster near (60,000, 5.5) and a sparser cluster near (95,000–100,000, 4.4–4.5), with a diagonal "bridge" of transitional points (e.g., 65,000–75,000 range, yields 4.7–4.9) rather than a continuous linear spread. - Non-linearity: The relationship looks more like a regime shift (rates fell as BTC rallied through the year) than a proportional linear response — the linear R² of 0.55 likely understates the fit of a threshold/logistic model. - No clear outliers — points align consistently with the two-regime pattern, suggesting this is macro-driven rather than noise-driven.
4. Confounding Factors and Caveats
This is almost certainly a spurious/confounded correlation driven by shared time trend, not a direct economic relationship. Both series moved due to the same macro backdrop in 2024: Treasury short-term yields declined as the Fed cut rates over the year, while BTC price rallied over the same period for unrelated reasons (ETF flows, halving, risk-on sentiment). Since both are trending over the same 2024 window, any two trending time series will show artificial correlation without genuine interaction — a classic case of spurious correlation via common time-trend, further supported by the Granger test failing to find causality.
5. Suggested Further Investigation
- Detrend or difference both series (e.g., use daily % changes rather than levels) and recompute correlation — this will likely reveal the true relationship is much weaker. - Add a time/date control variable or use cointegration testing to check if this is trend-driven. - Segment analysis: model the two regimes separately (rate-cut period vs. stable period) rather than fitting one global linear model. - Compare against other explanatory variables (Fed policy announcements, CPI releases) that likely drive yields independently of BTC price, and vice versa for BTC (liquidity, ETF flows). - Treat this correlation as descriptive/associative only — not suitable for trading or forecasting strategies given the null Granger causality result.
X dataset: CryptoDataDownload – Binance BTC/USDT Daily OHLCV
Y dataset: Daily Treasury Par Yield Curve Rates
Part of experiment: Bitcoin - CryptoDataDownload – Binance BTC/USDT Daily OHLCV vs Daily Treasury Par Yield Curve Rates