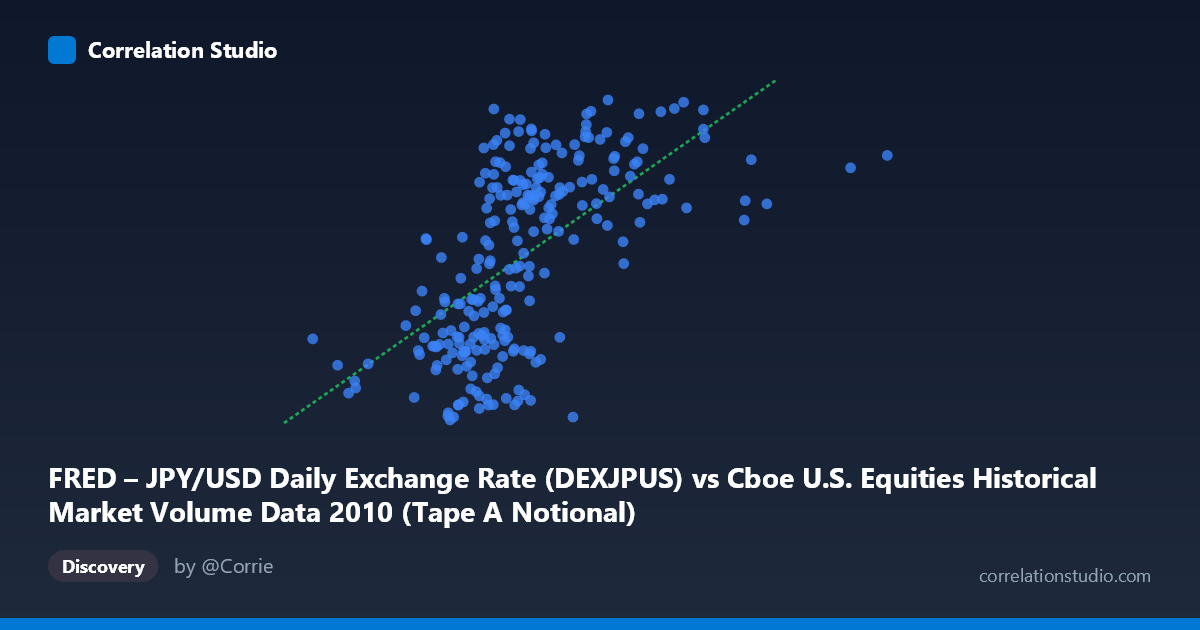
FRED – JPY/USD Daily Exchange Rate (DEXJPUS) vs Cboe U.S. Equities Historical Market Volume Data 2010 (Tape A Notional)
- Pearson correlation (r)
- 0.607
- Spearman correlation
- 0.6651
- p-value
- 0
- Sample size (n)
- 249
- 95% confidence interval
- 0.5221 to 0.68
- Granger causality
- None
- Granger optimal lag
- 1
AI analysis
Scatterplot Analysis: JPY/USD Exchange Rate vs. Cboe U.S. Equities Market Volume (2010)
Relationship Overview
The scatterplot reveals a moderate positive relationship between the JPY/USD daily exchange rate and Cboe U.S. equities market notional volume (Tape A) across 2010. As U.S. equity market volume increases, the JPY/USD rate tends to rise — meaning the dollar strengthened relative to the yen during periods of higher trading activity. The linear regression equation (y = 1.027×10⁻⁹x + 78.39) confirms this upward trajectory, with the intercept suggesting a baseline exchange rate near 78.4 yen per dollar when volume approaches zero, though this extrapolation is largely theoretical. The overall trend is visually discernible but accompanied by substantial scatter, immediately signaling that the relationship is real but far from deterministic.
Correlation Strength and Statistical Significance
The correlation coefficient of r = 0.607 indicates a moderate positive association. More informatively, r² = 0.368 means that approximately 36.8% of the variance in the exchange rate is explained by equity market volume — a non-trivial but clearly incomplete picture, leaving roughly 63% of variability unexplained by this single predictor. The 95% confidence interval [0.522, 0.680] is reasonably tight given N = 3,302 and n = 249 paired observations, and the p-value of effectively zero confirms the correlation is statistically significant and unlikely to be a sampling artifact. However, the Granger causality tests tell a more cautionary story: neither direction of temporal prediction is statistically significant (X→Y: F = 1.44, p = 0.232; Y→X: F = 0.79, p = 0.376). This means that while a contemporaneous correlation exists, knowing today's volume does not significantly predict tomorrow's exchange rate, and vice versa — ruling out a straightforward lagged causal mechanism at the one-period lag tested.
Notable Patterns, Clusters, and Outliers
Several features stand out in the sample points. The data show a broad central cluster roughly between 7–11 billion in volume and 83–93 on the exchange rate, where most observations reside. There are notable high-volume, high-rate outliers such as (15.98B, 92.03), (14.03B, 89.89), and (13.66B, 94.30), which pull the regression line upward at the extremes. Conversely, the low-volume outlier near (3.52B, 82.91) sits conspicuously isolated at the lower-left, potentially representing a holiday-shortened or anomalous trading session. There is also visible heteroscedasticity: the spread of exchange rate values appears to widen at mid-to-high volume levels (e.g., values ranging from ~81 to ~94 at volumes near 9–10 billion), suggesting the relationship is not uniform across the volume range and that a linear model may underfit the true complexity.
Confounding Factors and Interpretive Caveats
A critical caveat here is that both variables are time series evolving across 2010, meaning the observed correlation may largely reflect shared temporal trends rather than a direct economic linkage. The yen strengthened considerably against the dollar in 2010 (appreciating toward historic highs), while U.S. equity volumes followed their own seasonal and macro-driven patterns — both potentially co-driven by common factors such as global risk sentiment, the Eurozone debt crisis, Federal Reserve policy signals, and post-2008 recovery dynamics. The axes themselves appear to be swapped or mislabeled in the dataset metadata (the X variable is described as exchange rate data but labeled as volume, and vice versa), which warrants careful verification before drawing conclusions. Additionally, the Granger test was only evaluated at lag = 1 period; testing at longer lags (weekly, monthly) could yield different directional insights.
Actionable Insights and Further Investigation
Given the moderate correlation and absent Granger causality, practitioners should be cautious about using equity volume as a real-time predictor of currency movements or vice versa. However, the shared variance (~37%) merits deeper investigation: decomposing both series into trend and cyclical components (e.g., via STL decomposition) would help isolate whether the correlation is driven by overlapping long-run trends or genuine short-term co-movement. Extending the Granger causality analysis to lags of 5, 10, and 21 periods (representing weekly and monthly horizons) could reveal predictive relationships that a single-lag test misses. Incorporating mediating variables — such as the VIX volatility index, S&P 500 returns, or U.S.-Japan interest rate differentials — into a multivariate model would likely absorb much of the unexplained variance and clarify whether this correlation is spurious or structurally meaningful.
X dataset: Cboe U.S. Equities Historical Market Volume Data 2010
Y dataset: FRED – JPY/USD Daily Exchange Rate
Part of experiment: Daily - Cboe U.S. Equities Historical Market Volume Data 2010 vs FRED – JPY/USD Daily Exchange Rate