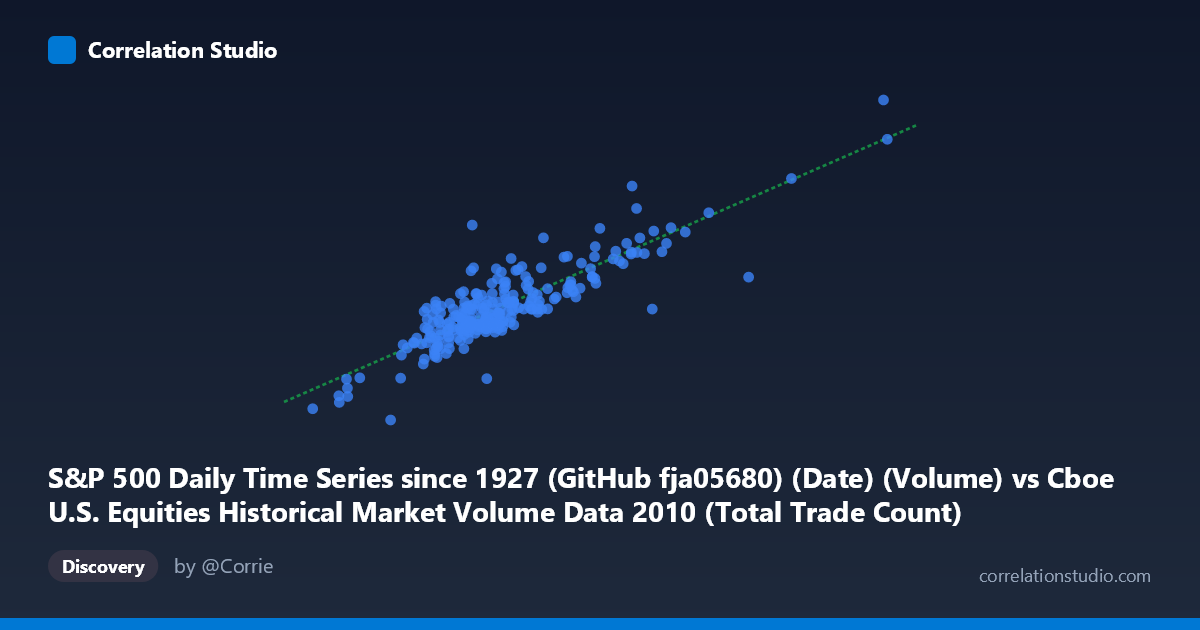
S&P 500 Daily Time Series since 1927 (GitHub fja05680) (Date) (Volume) vs Cboe U.S. Equities Historical Market Volume Data 2010 (Total Trade Count)
- Pearson correlation (r)
- 0.8648
- Spearman correlation
- 0.7889
- p-value
- 0
- Sample size (n)
- 252
- 95% confidence interval
- 0.8299 to 0.893
- Granger causality
- None
- Granger optimal lag
- 10
AI analysis
Analysis: S&P 500 Trading Volume vs. Total Trade Count (2010)
Relationship Overview The scatterplot reveals a strong positive relationship between daily S&P 500 trading volume (X-axis, measured in shares) and the total trade count across U.S. equities exchanges (Y-axis). As trading volume increases, the number of discrete trades rises in a broadly consistent, upward-sloping pattern. This is intuitive: higher volume days tend to involve more individual transactions rather than simply larger block trades. The linear regression equation (y = 1506.45x + 1.20×10⁹) suggests that for every additional unit of volume, trade count increases by approximately 1,506 transactions, with a baseline of roughly 1.2 billion trades even at low volume levels.
Correlation Strength and Statistical Significance The Pearson correlation of r = 0.8648 is strong, and the coefficient of determination r² = 0.7479 tells a nuanced story: approximately 74.8% of the variance in total trade count is explained by trading volume, leaving about 25% attributable to other factors. The 95% confidence interval of [0.8299, 0.8930] is notably tight, reflecting the large sample size (n = 252 paired observations from a population of 3,302), and the p-value of essentially 0 confirms this association is not attributable to chance. However, the Granger causality results are telling: neither direction (X→Y nor Y→X) reached significance at the optimal 10-period lag (F = 1.52, p = 0.13 for X→Y; F = 0.74, p = 0.69 for Y→X). This means that while the two variables are strongly contemporaneously correlated, neither reliably predicts the other across time — they appear to move together in response to shared underlying drivers rather than one causing the other.
Patterns, Clusters, and Outliers The data exhibits a reasonably tight central cluster for moderate volume days (roughly 1.5M–3.0M on X, corresponding to 3.0B–6.0B on Y), consistent with typical 2010 trading conditions. However, several notable outliers are visible: the point near (5,514,534; 9,472,910,000) represents an extreme high-volume, high-trade-count day significantly beyond the main cluster, likely tied to a specific market event (e.g., the May 6, 2010 Flash Crash or a major macro announcement). Conversely, the point at (1,308,179; 1,285,590,000) anchors the lower-left as a clear low-activity outlier, possibly a holiday-shortened trading session. A point at (4,340,243; 5,452,130,000) appears anomalous — very high volume but comparatively modest trade count, suggesting that day involved larger average trade sizes (fewer but bigger transactions), which deviates from the general trend and warrants specific investigation.
Confounding Factors and Caveats Several important caveats apply. First, both variables are likely co-driven by the same market conditions — volatility spikes, earnings seasons, or macro events simultaneously inflate both volume and trade count, making the correlation partially spurious as a causal mechanism. Second, the rise of high-frequency trading (HFT) in 2010 means trade count can inflate dramatically without proportionate volume increases, as HFT generates many small-lot orders; this explains some of the scatter. Third, the dataset covers only one calendar year (2010), a specific post-crisis period with distinct structural characteristics, so generalizability is limited. Finally, the Y-axis label attribution appears swapped in dataset sourcing (trade count data labeled under the S&P 500 dataset), which should be verified to ensure no data alignment errors exist.
Actionable Insights and Further Investigation Practitioners monitoring market microstructure should note that volume alone is a reasonable but imperfect proxy for market activity, explaining ~75% of trade count variation. For a more complete picture, average trade size (volume ÷ trade count) should be tracked separately — the anomalous high-volume/low-trade-count outlier specifically suggests days where institutional block trading dominates. Further investigation should include: (1) identifying specific calendar dates for the extreme outliers to contextualize market events; (2) extending the analysis across multiple years to test whether the r² remains stable or degrades as HFT dynamics evolve; (3) introducing volatility (e.g., VIX) as a third variable to quantify how much of the unexplained 25% variance it captures; and (4) segmenting by exchange venue, since the Cboe-specific data may behave differently from aggregate market totals represented in the S&P 500 volume series.
X dataset: Cboe U.S. Equities Historical Market Volume Data 2010
Y dataset: S&P 500 Daily Time Series since 1927 (GitHub fja05680) (Date)
Part of experiment: Daily - Cboe U.S. Equities Historical Market Volume Data 2010 vs S&P 500 Daily Time Series since 1927 (GitHub fja05680) (Date)