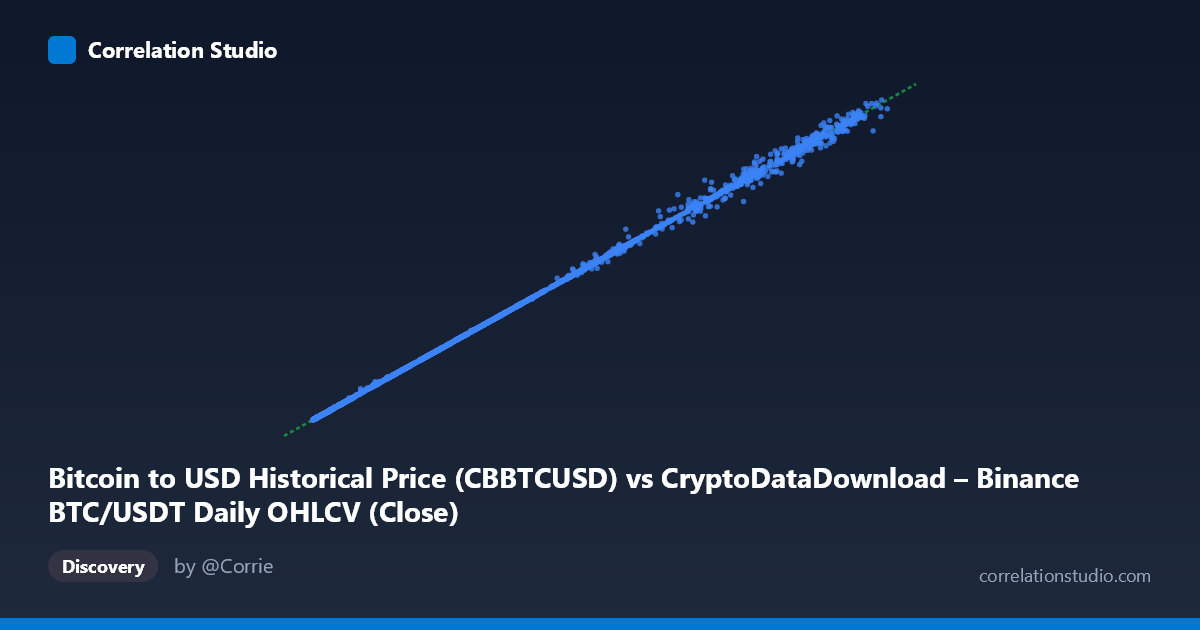
Bitcoin to USD Historical Price (CBBTCUSD) vs CryptoDataDownload – Binance BTC/USDT Daily OHLCV (Close)
- Pearson correlation (r)
- 0.9997
- Spearman correlation
- 0.9999
- p-value
- 0
- Sample size (n)
- 3211
- 95% confidence interval
- 0.9997 to 0.9997
- Granger causality
- None
- Granger optimal lag
- 10
- Time coverage
- 2017-08-17 to 2026-06-25
- Recomputed on refreshed data
- 2026-10-25 (r was 0.9997)
AI analysis
Analysis: BTC/USDT (Binance) vs. BTC/USD (Coinbase) Daily Close Prices
1. What the Visualization Reveals
This scatterplot essentially shows two measurements of the same underlying asset — Bitcoin's price — sourced from two different exchanges (Binance and Coinbase). The points trace an almost perfect straight line from the lower-left (~$3,200) to the upper-right (~$124,700), spanning nearly 8 years of daily data (2017–2026). This is not a relationship between two distinct economic variables in the traditional sense, but rather a cross-exchange price consistency check. The tight linear band confirms that Bitcoin's price is arbitraged efficiently across major exchanges, with negligible divergence even as the price scaled by more than 30x over the sample period.
2. Strength, Direction, and Predictive Relationship
The correlation is essentially as strong as empirically possible: r = 0.9997, r² = 0.9994, meaning 99.94% of the variance in Coinbase's Y price is explained by Binance's X price (and vice versa). The 95% CI [0.9997, 0.9997] is razor-thin, and p = 0 confirms this is not a chance finding — with n=3,211 daily observations, statistical power is very high. The regression slope (1.00019) and near-zero intercept (14.92) indicate the two series are essentially 1:1 equivalent, not merely correlated. Practically, this means arbitrage between Binance and Coinbase has kept prices synchronized to within fractions of a percent on a daily closing basis. Notably, the Granger causality test shows no significant lead-lag relationship in either direction (p ≈ 0.85 both ways) — neither exchange's price systematically predicts the other's future moves at daily granularity. This is expected: with instantaneous or near-instantaneous arbitrage, any transient divergence is corrected within the same day, not across days, so lagged causality is not detectable at this resolution.
3. Notable Patterns and Outliers
The scatter is remarkably homogeneous — no visible clusters, regime breaks, or curvature; the relationship holds equally well at $5,000 and $120,000 price levels, suggesting the tracking error is proportional (percentage-based) rather than additive, which is consistent with market microstructure (bid-ask spreads and slippage scale with price). Some sample rows show modest deviations (e.g., 90,360 vs. 87,447; 120,134 vs. 123,366; 5,987 vs. 5,948) — these likely correspond to periods of elevated volatility, exchange-specific liquidity crunches, or brief dislocations (e.g., flash crashes, regulatory news hitting one exchange before another). These are still tiny in percentage terms (<3%) but represent the primary "noise" in an otherwise near-deterministic relationship.
4. Confounding Factors and Caveats
Because X and Y are just two price feeds for the same asset, standard causal-inference caveats (confounding variables, omitted variable bias) don't really apply the way they would for genuinely independent phenomena. The near-1.0 slope and high R² are somewhat "trivial" findings — they primarily validate data integrity and market efficiency rather than revealing an economic relationship. A key caveat: aggregating to daily closes masks intraday lead-lag dynamics; if Granger causality were tested on minute-level or hourly data, one exchange (likely the more liquid, e.g., Binance) might show a small but detectable lead over the other. Also worth checking: timezone/close-time alignment between Coinbase's and Binance's "daily close" definitions could introduce small phase mismatches.
5. Suggestions for Further Investigation
- Test intraday/high-frequency data (minute or hourly bars) to detect genuine microstructure lead-lag effects that daily aggregation obscures. - Examine the residuals (Y − predicted Y) over time to identify specific dates/events driving the largest deviations — these may correspond to known market stress events (exchange outages, hacks, regulatory news) and could be useful for studying market fragmentation risk. - Compute a rolling correlation/spread rather than a single static r, to check whether cross-exchange basis has widened or narrowed with time (e.g., during 2022 exchange collapses). - Given the near-identical series, this dataset is better used as a data-quality/arbitrage-efficiency study than as a predictive modeling exercise between two independent variables.
X dataset: CryptoDataDownload – Binance BTC/USDT Daily OHLCV
Y dataset: Bitcoin to USD Historical Price
Part of experiment: Bitcoin - CryptoDataDownload – Binance BTC/USDT Daily OHLCV vs Bitcoin to USD Historical Price