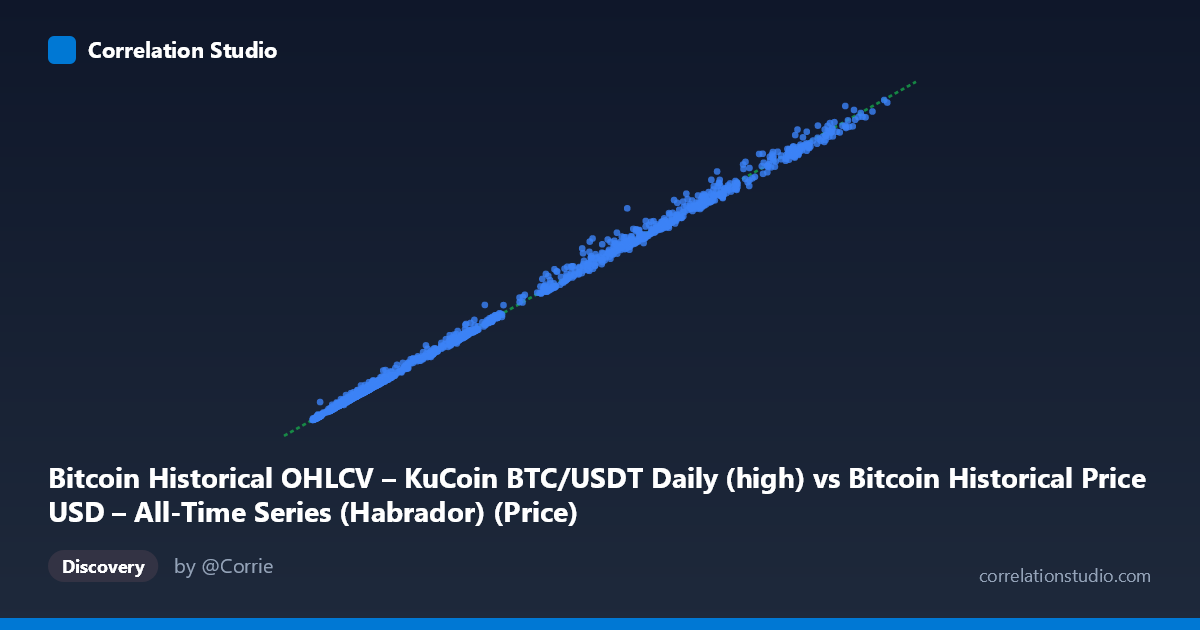
Bitcoin Historical OHLCV – KuCoin BTC/USDT Daily (high) vs Bitcoin Historical Price USD – All-Time Series (Habrador) (Price)
- Pearson correlation (r)
- 0.9992
- Spearman correlation
- 0.9986
- p-value
- 0
- Sample size (n)
- 1861
- 95% confidence interval
- 0.9991 to 0.9992
- Granger causality
- None
- Granger optimal lag
- 10
AI analysis
Analysis: Bitcoin Price Cross-Dataset Comparison
1. What the Visualization Reveals
This scatterplot compares Bitcoin's daily high price from one historical dataset (Habrador) against price data from a different source (KuCoin BTC/USDT). The points trace an almost perfectly straight diagonal line from roughly $3,200 to $69,000, spanning Bitcoin's major price cycles from late 2017 through late 2022 (including the 2017 run-up, 2018-2019 bear market, 2020-2021 bull run to ~$69K, and subsequent decline). The tight linear clustering with virtually no scatter around the trend line indicates these two datasets are measuring essentially the same underlying phenomenon.
2. Strength, Direction, and Statistical Confidence
The correlation is exceptionally strong (r = 0.9992, r² = 0.9984), meaning 99.84% of the variance in Y is explained by X — leaving less than 0.2% attributable to noise, measurement differences, or divergence between sources. The 95% CI [0.9991, 0.9992] is extremely narrow given the large sample (n=1,861), and p ≈ 0 confirms this relationship is not due to chance. The regression slope (1.026) and near-zero intercept (44.20) indicate a nearly 1:1 relationship with only a slight systematic scaling difference. Critically, the Granger causality tests show no significant predictive direction in either direction (both p 0.95) — this is expected and important: it confirms these are not two independent variables where one drives the other, but rather two near-simultaneous measurements of the same asset's price. Treating this as a "leading indicator" relationship would be a misinterpretation.
3. Notable Patterns and Deviations
The line is remarkably clean, but subtle deviations exist at higher price levels — points like (28936, 32256), (45237, 48648), and (51503, 54868) show Y running noticeably higher than X, suggesting mild divergence during volatile, high-price periods (likely 2021 bull-market spikes). This is plausible: intraday highs can differ meaningfully across exchanges/sources during high-volatility windows due to liquidity differences, flash spikes, or timestamp/timezone misalignment. No clusters or regime breaks are evident — the relationship holds consistently across the full $3K–$69K range, indicating stability across bear and bull markets alike.
4. Confounding Factors and Caveats
The key caveat is that this isn't a correlation between two distinct economic variables — it's a cross-source consistency check for the same asset (Bitcoin price), so near-perfect correlation is expected and doesn't imply insight into causal market dynamics. Sources of the small residual variance likely include: (a) different exchanges (KuCoin vs. an aggregated historical source) reflecting slightly different order books/liquidity, (b) differing daily aggregation windows or timezones for computing "high," (c) potential data-cleaning or interpolation differences in the Habrador dataset for earlier, sparser periods. The Granger non-causality result should not be read as "no relationship" — it simply confirms neither series leads the other, consistent with them being contemporaneous measurements.
5. Actionable Insights
This analysis is best used as a data validation exercise rather than a market-relationship study — the near-1:1 slope and high r² confirm the two datasets can be used interchangeably or merged with minor calibration (apply the regression: Y ≈ 1.026X + 44.20). For further investigation: (1) isolate and inspect the outlier periods (high-volatility 2021 dates) to determine if divergence stems from exchange-specific flash prices; (2) check whether residuals correlate with trading volume or volatility (e.g., using a rolling ATR), which might explain the small variance during price spikes; (3) if building a unified price feed, use this regression to reconcile discrepancies rather than treating one source as ground truth.
X dataset: Bitcoin Historical Price USD – All-Time Series (Habrador)
Y dataset: Bitcoin Historical OHLCV – KuCoin BTC/USDT Daily
Part of experiment: Bitcoin - Bitcoin Historical Price USD – All-Time Series (Habrador) vs Bitcoin Historical OHLCV – KuCoin BTC/USDT Daily