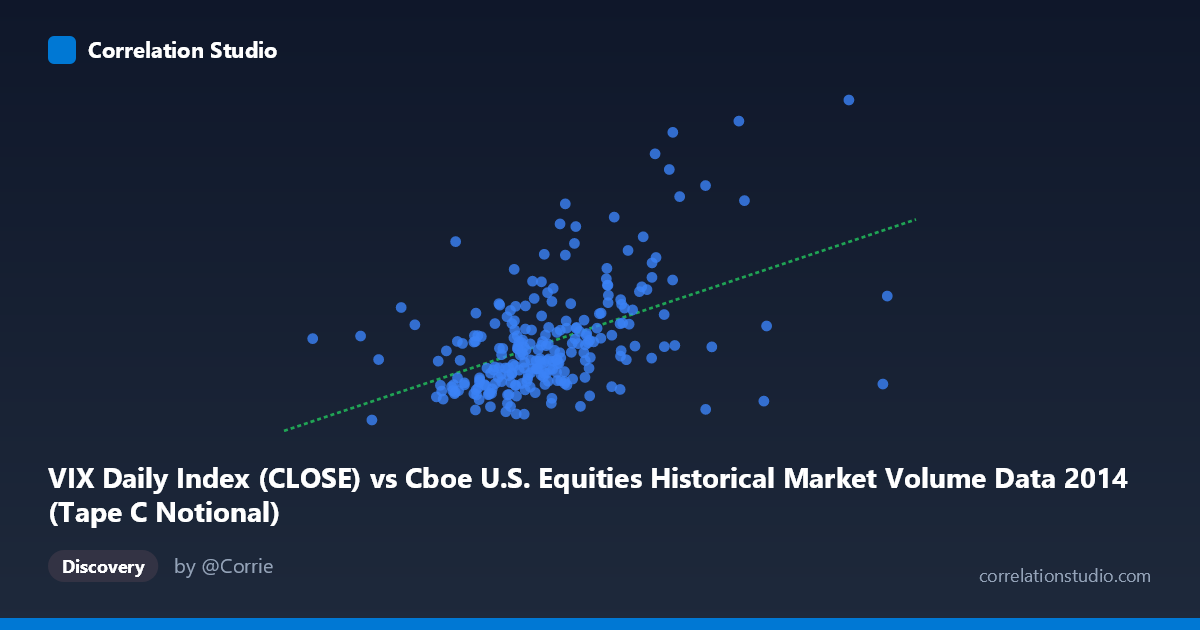
VIX Daily Index (CLOSE) vs Cboe U.S. Equities Historical Market Volume Data 2014 (Tape C Notional)
- Pearson correlation (r)
- 0.4843
- Spearman correlation
- 0.4665
- p-value
- 0
- Sample size (n)
- 252
- 95% confidence interval
- 0.3837 to 0.5736
- Granger causality
- None
- Granger optimal lag
- 1
AI analysis
Scatterplot Analysis: VIX Daily Index vs. Tape C Notional Volume (2014)
Relationship Overview
The scatterplot reveals a moderate positive relationship between the CBOE VIX Daily Index (Close) and Tape C Notional trading volume across U.S. equities exchanges in 2014. As VIX levels rise — indicating higher expected market volatility — Tape C Notional volume tends to increase as well. This is broadly intuitive: periods of elevated fear or uncertainty typically drive higher trading activity as market participants rebalance, hedge, or liquidate positions. The linear regression equation (y = 1.36×10⁻⁹x + 7.59) confirms a positive slope, though the relationship is clearly noisy with considerable scatter around the fitted line.
Correlation Strength and Statistical Significance
The Pearson correlation of r = 0.484 indicates a moderate positive association, but the coefficient of determination r² = 0.235 tells a more sobering story — only 23.5% of the variance in VIX is explained by Tape C Notional volume, leaving roughly three-quarters of VIX variability unexplained by this single predictor. The 95% confidence interval of [0.38, 0.57] is reasonably tight, suggesting the true population correlation is meaningfully above zero, and the p-value of 2.22×10⁻¹⁶ confirms the relationship is highly statistically significant — effectively ruling out chance. However, statistical significance with n=252 drawn from a population of 3,686 should not be conflated with practical or predictive significance. Critically, Granger causality tests in both directions fail to reach significance (X→Y: F=0.18, p=0.67; Y→X: F=0.15, p=0.70), meaning neither variable temporally predicts the other at a 1-period lag. This strongly suggests the relationship is contemporaneous rather than directional — they move together, but neither leads the other in a predictively useful way.
Notable Patterns, Clusters, and Outliers
Several structural features are visible in the data. The bulk of observations cluster in the VIX range of roughly 11–17 paired with moderate Tape C Notional values, forming a dense core. There are notable high-leverage outliers in the upper-right quadrant — particularly two to three points where VIX exceeds 23–26 alongside very high notional values (e.g., ~25.2 at x≈7.18×10⁹ and ~23.6 at x≈6.15×10⁹), which appear to disproportionately drive the positive correlation. Conversely, several points show high X values (large notional volume) paired with low VIX (e.g., ~10.85 at x≈6.77×10⁹), suggesting the relationship is not monotonically clean. This asymmetry hints at a non-linear or regime-dependent structure, where the correlation strengthens primarily during stress episodes rather than holding uniformly across the full range.
Confounding Factors and Caveats
Several important caveats temper interpretation. First, axis assignment appears counterintuitive — VIX (a volatility index) is plotted on the X-axis while Tape C Notional (a volume measure) is on the Y-axis, yet both datasets' labels reference each other's source, suggesting a possible metadata or labeling inconsistency that warrants verification. Second, the 2014 sample period includes specific macro events (e.g., geopolitical tensions mid-year, Fed tapering discussions) that could create spurious episodic clustering rather than a stable structural relationship. Third, calendar and seasonal effects — such as end-of-quarter rebalancing or low-volume holiday periods — may jointly influence both series without one causing the other. Finally, Tape C covers only a subset of U.S. equity tapes, so it may not fully represent aggregate market activity.
Actionable Insights and Further Investigation
Given the moderate correlation but absence of Granger causality, practitioners should avoid using lagged volume as a VIX predictor (or vice versa) in trading models without additional covariates. A productive next step would be to test for non-linearity — a threshold or piecewise regression separating low-VIX (below ~16) from high-VIX regimes may reveal that the correlation is largely driven by stress periods and nearly flat otherwise. Incorporating all three tapes (A, B, C) into a composite volume measure could improve explanatory power. It would also be valuable to extend the time series beyond 2014 to test whether this relationship is stable across different volatility regimes (e.g., 2018 or 2020). Finally, examining intraday data or shorter time aggregations might uncover lead-lag dynamics that the daily 1-period Granger test misses.
X dataset: Cboe U.S. Equities Historical Market Volume Data 2014
Y dataset: VIX Daily Index
Part of experiment: Daily - Cboe U.S. Equities Historical Market Volume Data 2014 vs VIX Daily Index