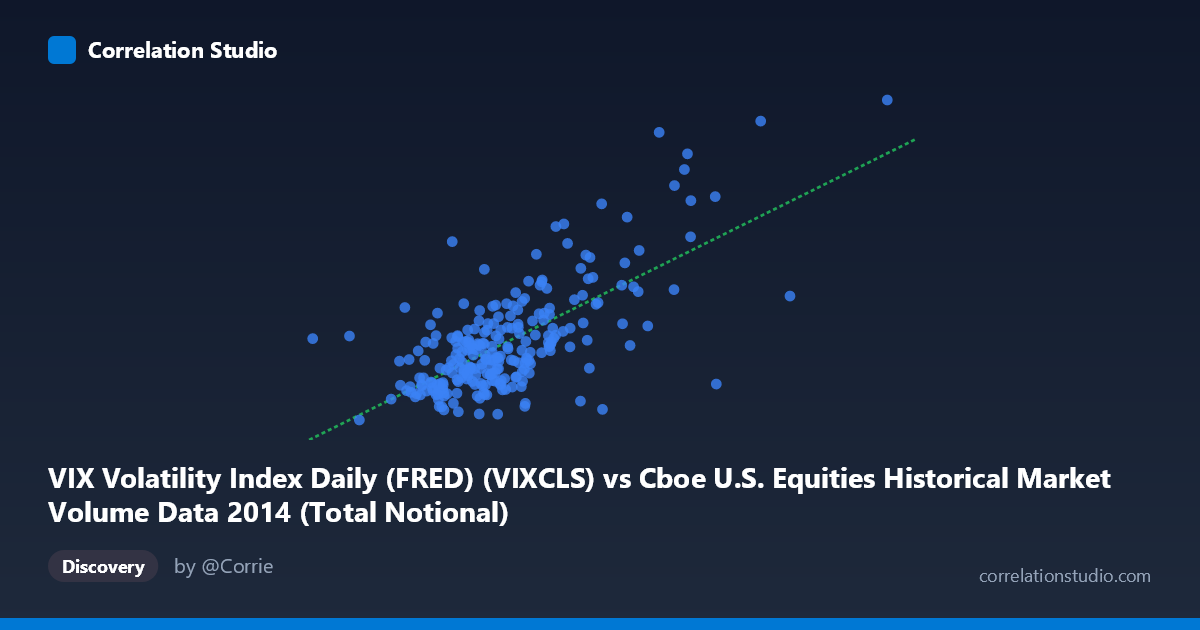
VIX Volatility Index Daily (FRED) (VIXCLS) vs Cboe U.S. Equities Historical Market Volume Data 2014 (Total Notional)
- Pearson correlation (r)
- 0.6915
- Spearman correlation
- 0.5705
- p-value
- 0
- Sample size (n)
- 252
- 95% confidence interval
- 0.621 to 0.7509
- Granger causality
- None
- Granger optimal lag
- 1
AI analysis
Analysis: VIX Volatility Index vs. Total Market Notional Volume (2014)
Relationship Overview The scatterplot reveals a positive relationship between U.S. equity market total notional trading volume (X-axis) and the VIX Volatility Index (Y-axis) across 252 trading days in 2014. As market notional volume increases, implied volatility as measured by the VIX tends to rise correspondingly. This aligns intuitively with market microstructure theory: periods of elevated fear and uncertainty (high VIX) naturally coincide with surges in trading activity as participants reposition, hedge, or liquidate. The linear regression equation y = 4.71×10⁻¹⁰x + 5.80 captures this upward trend, though the scatterplot likely shows considerable dispersion around the regression line, particularly at higher volume levels.
Correlation Strength and Statistical Significance The correlation of r = 0.6915 indicates a moderately strong positive association, but the explanatory power deserves careful framing: r² = 0.4782 means that only ~47.8% of the variance in VIX is explained by notional volume, leaving over half the variance attributable to other factors. The 95% confidence interval of [0.621, 0.751] is reasonably tight, suggesting the estimate is stable, and the p-value of effectively zero confirms this relationship is not a chance artifact given n = 252 paired observations from a population of N = 3,686. However, the Granger causality results are notably absent in both directions — neither volume predicting VIX (F = 1.13, p = 0.29) nor VIX predicting volume (F = 0.22, p = 0.64) reaches significance at a 1-period lag. This is a critical finding: despite a meaningful contemporaneous correlation, neither variable reliably predicts the other the following day, suggesting the relationship is largely simultaneous rather than temporally sequential.
Notable Patterns, Clusters, and Outliers The sample points reveal several structural features worth noting. The bulk of observations cluster in the 14–17 billion notional volume range with VIX values between 11 and 16, forming a dense central mass. However, there are clearly visible high-leverage outliers at elevated volume and VIX levels — for instance, the point at approximately (31.2B, 25.20) and (27.3B, 23.57) sit far from the central cluster and likely correspond to specific volatility events in late 2014, such as the October market correction driven by Ebola fears and geopolitical tensions. Conversely, there is an interesting anomaly at (22.9B, 10.85) — high volume but unusually low VIX — suggesting that some high-volume days reflect risk-on, momentum-driven trading rather than fear. This non-linearity at extremes implies a heteroscedastic relationship where variance in VIX expands significantly at higher volume levels.
Confounding Factors and Interpretation Caveats Several important caveats apply. First, reverse causality cannot be dismissed despite Granger results at lag-1; same-day feedback loops between volatility and volume are well-documented in market microstructure literature. Second, both variables are jointly driven by common external shocks — macroeconomic announcements, geopolitical events, Federal Reserve communications, and index rebalancing events — making it difficult to isolate a clean directional mechanism. Third, notional volume is price-sensitive: a rising market with high prices mechanically inflates notional value even with constant share volume, potentially introducing a spurious component. Fourth, the 2014 sample period is relatively benign by historical standards (VIX rarely exceeded 25), limiting generalizability to crisis regimes. Finally, the Granger test at only optimal lag = 1 period may be too restrictive; multi-day lagged relationships deserve exploration.
Actionable Insights and Further Investigation Practitioners monitoring intraday or daily risk exposures could use notional volume as a contemporaneous signal for VIX regime shifts, though its predictive limitation at lag-1 counsels against using yesterday's volume alone to forecast today's VIX. For further investigation, analysts should: (1) test Granger causality at multiple lags (2–5 days) to rule out delayed predictive relationships; (2) stratify the analysis by market regime (low/medium/high VIX terciles) to examine whether the correlation strengthens during stress periods; (3) replace notional volume with share volume to decouple the price-inflation artifact; (4) apply a non-linear model (e.g., log-log regression or spline) given the apparent heteroscedasticity at high values; and (5) extend to multi-year data to test whether this 2014 relationship holds across different volatility regimes, particularly during the 2018 or COVID-era spikes.
X dataset: Cboe U.S. Equities Historical Market Volume Data 2014
Y dataset: VIX Volatility Index Daily (FRED)
Part of experiment: Daily - Cboe U.S. Equities Historical Market Volume Data 2014 vs VIX Volatility Index Daily (FRED)