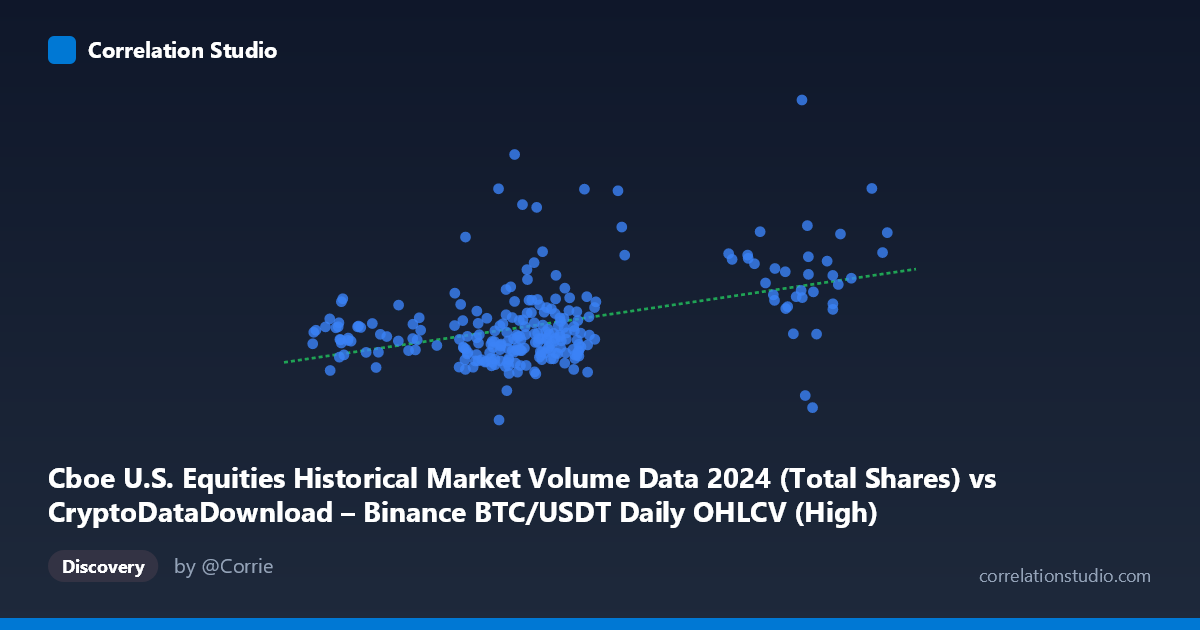
Cboe U.S. Equities Historical Market Volume Data 2024 (Total Shares) vs CryptoDataDownload – Binance BTC/USDT Daily OHLCV (High)
- Pearson correlation (r)
- 0.4351
- Spearman correlation
- 0.3502
- p-value
- 0
- Sample size (n)
- 252
- 95% confidence interval
- 0.3293 to 0.5302
- Granger causality
- None
- Granger optimal lag
- 10
AI analysis
Analysis: Cboe U.S. Equities Volume vs. Binance BTC/USDT High
1. Relationship Overview
The scatterplot displays a modest positive relationship between Cboe U.S. equities market volume (X-axis) and Binance BTC/USDT daily high price (Y-axis) across 252 paired daily observations from 2024. Points show a loose upward drift, with the linear regression line (y = 3385.67x + 4.12×10⁸) indicating that as equity volume increases, BTC price tends to rise as well—but the scatter around this line is substantial, reflecting a relationship that is real but far from tight or deterministic.
2. Strength, Direction, and Statistical Confidence
The correlation coefficient (r = 0.435) indicates a moderate positive relationship, but r² = 0.189 reveals that only ~19% of the variance in BTC's daily high is explained by equity trading volume—leaving over 80% attributable to other factors. The 95% confidence interval [0.329, 0.530] is reasonably tight and does not cross zero, and the p-value (4.585×10⁻¹³) is highly significant, confirming this correlation is not due to chance in this sample. However, statistical significance ≠ practical strength: with r² under 0.20, this variable alone offers limited predictive power for BTC pricing.
Critically, the Granger causality tests show no significant predictive direction in either direction (X→Y: p=0.264; Y→X: p=0.858) even at an optimal lag of 10 periods. This means neither variable reliably leads the other in time—the correlation appears to be contemporaneous/coincidental rather than causal or predictive, likely both responding to a shared external driver (e.g., overall market risk sentiment, macro liquidity conditions) rather than one influencing the other.
3. Notable Patterns and Outliers
The data shows a dense cluster of X values between 58,000–72,000 with Y values scattered widely from ~500M to ~950M, suggesting high variance in BTC price at similar equity volume levels. A secondary cluster appears at higher X values (96,000–103,000) with Y values in the 680M–825M range, which may correspond to specific high-volume trading days (possibly month-end, quarterly rebalancing, or major market events). Notable outliers include a point at (65,067, 965.9M)—unusually high BTC price for moderate equity volume—and (62,286, 379.7M), the lowest Y value in the dataset paired with mid-range X. These outliers pull on the regression line disproportionately given the modest sample size.
4. Confounding Factors and Caveats
Several caveats warrant attention: - Spurious correlation risk: Both series are time-indexed macro/financial variables in 2024 that could share common trends (e.g., risk-on/risk-off regimes, Fed policy shifts, or seasonal volume patterns) without direct causal linkage. - Non-stationarity: Financial time series often exhibit trends that inflate correlation; differencing or detrending both series would clarify whether this is a genuine relationship or an artifact of shared drift. - Sample size: n=252 (daily data) drawn from a stated population of N=3,212 suggests this may be a subsample—selection method should be verified for representativeness. - Omitted variables: Broader risk appetite indices (VIX), crypto-specific volume/liquidity metrics, or macro announcements (CPI, FOMC) likely have stronger explanatory power for BTC price than equity share volume alone.
5. Actionable Recommendations
Given the weak Granger causality and modest r², this pair should not be used for predictive trading models without additional variables. Suggested next steps: (1) test correlation with equity notional value or volatility rather than raw share volume, which may better proxy market stress; (2) run the analysis on log-returns instead of levels to address non-stationarity concerns; (3) incorporate a multivariate model including known BTC drivers (DXY, real yields, crypto-specific volume) to see if equity volume retains explanatory power once confounders are controlled; (4) investigate the identified outlier dates for confirmable news events that could explain the divergence.
X dataset: CryptoDataDownload – Binance BTC/USDT Daily OHLCV
Y dataset: Cboe U.S. Equities Historical Market Volume Data 2024
Part of experiment: Bitcoin - CryptoDataDownload – Binance BTC/USDT Daily OHLCV vs Cboe U.S. Equities Historical Market Volume Data 2024