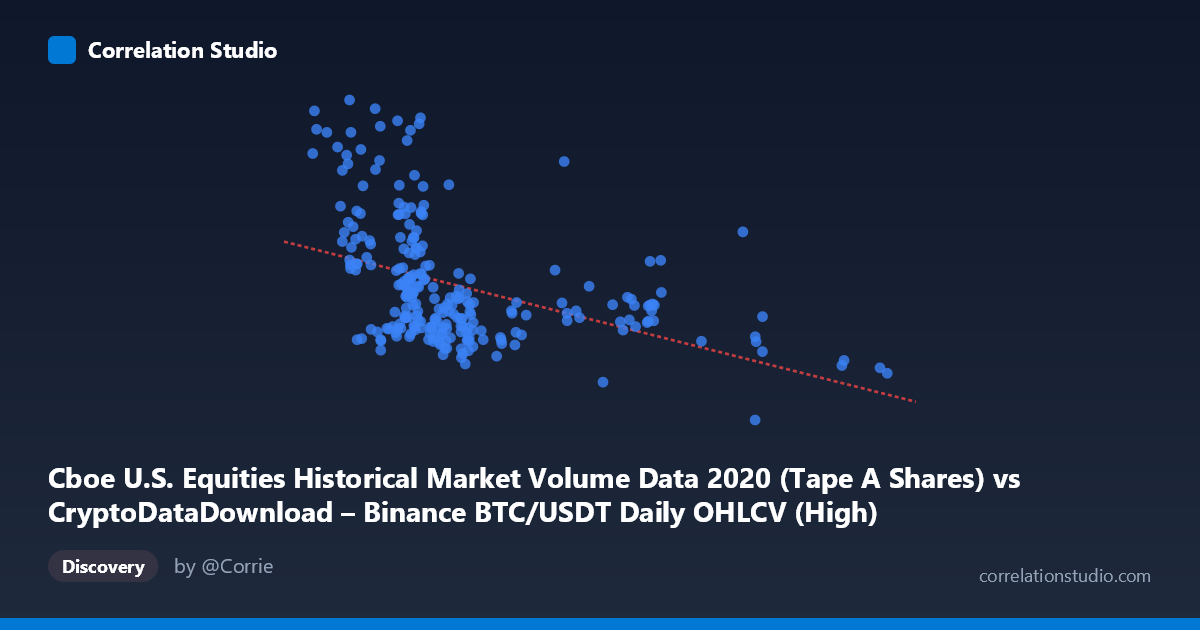
Cboe U.S. Equities Historical Market Volume Data 2020 (Tape A Shares) vs CryptoDataDownload – Binance BTC/USDT Daily OHLCV (High)
- Pearson correlation (r)
- -0.4318
- Spearman correlation
- -0.5204
- p-value
- 0
- Sample size (n)
- 253
- 95% confidence interval
- -0.5271 to -0.3259
- Granger causality
- None
- Granger optimal lag
- 10
- Time coverage
- 2020-01-02 to 2020-12-31
AI analysis
Analysis: Cboe Equities Volume vs. Binance BTC/USDT Price
1. Relationship Overview
The scatterplot displays a modest negative association between the two variables — as X increases, Y tends to decrease, though the relationship is far from deterministic. Points are heavily concentrated in the lower-left region (X: 7,000–13,000; Y: 200M–400M), with a long tail of sparse observations extending to higher X values (up to ~29,300) where Y values cluster tightly near the lower bound (~200M–270M). This creates a visual impression of a downward-sloping trend driven substantially by the spread of high-X points rather than a uniform linear decline across the full range.
2. Strength, Direction, and Statistical Confidence
The correlation coefficient (r = -0.432) indicates a moderate negative relationship, but r² = 0.187 reveals that only 18.7% of the variance in Y is explained by X — leaving over 80% attributable to other factors or noise. The 95% CI [-0.527, -0.326] is reasonably tight and excludes zero, and the p-value (6.5E-13) confirms the correlation is highly unlikely due to chance in this sample. However, statistical significance should not be conflated with practical strength: this is a weak-to-moderate relationship, not one suitable for reliable point prediction.
Critically, the Granger causality tests show no significant predictive direction in either direction (X→Y: p=0.899; Y→X: p=0.683). This means that despite the contemporaneous correlation, neither variable's past values help forecast the other's future values at the tested lag structure (10 periods). This strongly suggests the correlation is either coincidental, driven by a shared external factor, or reflects a relationship that isn't temporally sequential in nature.
3. Notable Patterns and Outliers
Several high-Y outliers stand out prominently: points like (8900, 535.6M), (9854.75, 540.0M), and (5955, 518.7M) sit far above the general cloud, all clustered at relatively low X values. This suggests that extreme volume spikes occur specifically when trading activity (X-axis) is low-to-moderate — possibly tied to specific calendar events (e.g., March 2020 COVID crash volatility) rather than a smooth functional relationship. Conversely, at high X values (18,000), Y values compress into a narrow, low band (~200M–330M), suggesting a ceiling effect or regime change at higher volumes. This heteroscedasticity (unequal variance across the X range) violates a key assumption of simple linear regression and hints at non-linear or regime-dependent dynamics rather than a constant linear slope.
4. Confounding Factors and Caveats
Both series are 2020 daily time series, a year dominated by extraordinary market stress (COVID crash, subsequent recovery, and unprecedented retail trading activity). Time itself is a likely confounder — both U.S. equity volumes and BTC prices may have been independently driven by macro volatility, liquidity conditions, or retail investor behavior during specific 2020 windows (e.g., March crash, year-end rally), producing spurious correlation without direct causal linkage. Additionally, comparing a crypto exchange's trading volume to equity market volume conflates two structurally different markets with different participant bases, regulatory environments, and liquidity drivers — the relationship may be capturing broad "risk-on/risk-off" sentiment rather than any mechanistic link.
5. Suggestions for Further Investigation
Given the lack of Granger causality, this correlation should not be used for forecasting one variable from the other. Instead: (a) test for a common driver — e.g., VIX, overall crypto market cap, or macro liquidity measures — via partial correlation or multivariate regression; (b) segment the analysis by 2020 sub-periods (pre-COVID, crash, recovery) to check if the correlation is driven entirely by the March 2020 outlier cluster; (c) explore non-linear or regime-switching models given the visible heteroscedasticity; and (d) investigate the high-Y outliers individually to determine if they correspond to specific dated events, which would clarify whether this is a genuine cross-market relationship or an artifact of a few extreme days.
X dataset: CryptoDataDownload – Binance BTC/USDT Daily OHLCV
Y dataset: Cboe U.S. Equities Historical Market Volume Data 2020
Part of experiment: Bitcoin - CryptoDataDownload – Binance BTC/USDT Daily OHLCV vs Cboe U.S. Equities Historical Market Volume Data 2020