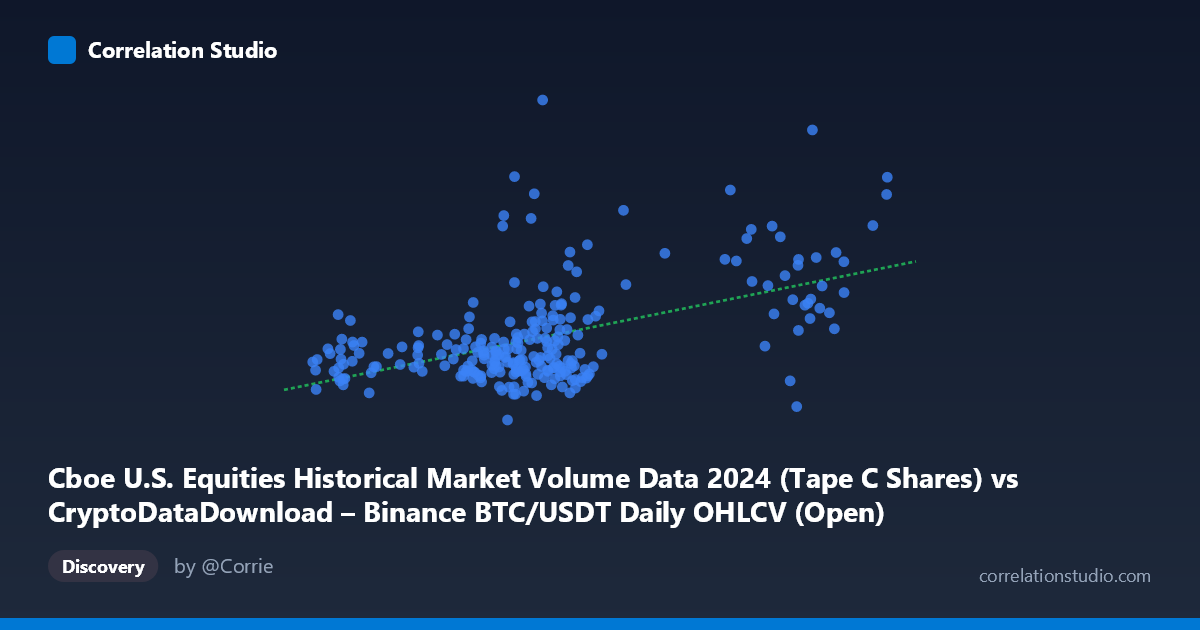
Cboe U.S. Equities Historical Market Volume Data 2024 (Tape C Shares) vs CryptoDataDownload – Binance BTC/USDT Daily OHLCV (Open)
- Pearson correlation (r)
- 0.5145
- Spearman correlation
- 0.3749
- p-value
- 0
- Sample size (n)
- 252
- 95% confidence interval
- 0.4175 to 0.6
- Granger causality
- None
- Granger optimal lag
- 10
- Time coverage
- 2024-01-02 to 2024-12-31
AI analysis
Analysis: Cboe Equities Volume vs. Binance BTC/USDT Open Price
1. What the Visualization Reveals
The scatterplot shows a moderate positive association between Cboe U.S. equities trading volume (Tape C shares) and Binance BTC/USDT daily opening price. Most points cluster in a relatively tight band — X between roughly 40,000–72,000 and Y between 250M–400M — with a smaller number of higher-X observations (~94,000–101,000) that appear to pull the regression line upward. The bulk of the data does not show an obviously tight linear trend; rather, there's a diffuse cloud with a general upward drift.
2. Strength, Direction, and Statistical Confidence
The correlation coefficient (r = 0.5145) indicates a moderate positive relationship, but r² = 0.2647 means only about 26.5% of the variance in Cboe equity volume is statistically associated with BTC price movements (or vice versa) — the majority (~73.5%) of variance remains unexplained by this bivariate relationship. The 95% CI [0.418, 0.600] is reasonably narrow and excludes zero, and the p-value (effectively 0) confirms this correlation is statistically robust and not due to chance, given n=252. However, statistical significance here reflects sample size and consistency, not necessarily practical strength — r² under 0.30 means this relationship alone has limited predictive utility.
Critically, the Granger causality tests show no significant temporal predictive direction in either direction (X→Y: p=0.427; Y→X: p=0.463). This means neither daily BTC prices nor equity volumes reliably help forecast future values of the other when accounting for lagged history (tested up to 10 lags). This is an important caveat: correlation exists in the static/contemporaneous sense, but there is no evidence of lead-lag predictive causality between these series in either direction.
3. Notable Patterns and Outliers
- The data shows a few notable high-leverage points: three observations near X≈94,000–101,000 (with Y in the 255M–406M range) sit well outside the main cluster and likely have outsized influence on the regression slope. - One clear outlier exists at (62,135, 199M) — the lowest Y-value in the dataset, sitting below the general trend. - Two high-Y outliers stand out: (65,235, 523M) and (64,870, 488M) — both near the median X but with unusually high equity volumes, suggesting volume spikes unrelated to BTC price level. - The bulk of the scatter (X: 55,000–70,000) shows substantial vertical spread (Y ranging from ~240M to over 500M), indicating that for similar BTC price levels, equity volume varies widely — consistent with the low r².
4. Confounding Factors and Caveats
This relationship is likely spurious or mediated by shared macro factors rather than reflecting direct economic linkage. Both series are time-indexed daily data over the same 2024 window, so: - Common temporal trends (e.g., both markets responding to Fed rate decisions, risk-on/risk-off sentiment, or seasonal volume patterns) could inflate correlation without genuine dependency. - Autocorrelation within each series (both volume and price tend to trend/cluster over consecutive days) can artificially strengthen apparent correlation between two autocorrelated series — a classic time-series pitfall. - Cboe Tape C volume reflects a specific equity subset (Nasdaq-listed and other Tape C securities), which may not represent broader market risk appetite well. - No evidence of causality (per Granger test) reinforces that this is likely a coincidental or confounded co-movement, not a mechanistic relationship.
5. Recommendations for Further Investigation
- Detrend or difference both series (e.g., use daily % changes rather than levels) and re-test correlation to control for autocorrelation and shared trend effects. - Introduce control variables such as VIX, overall market volume (Tape A/B), or crypto market-wide volume/sentiment indices to test whether the BTC–equity volume link survives after conditioning on broader risk sentiment. - Investigate the outlier cluster (X 90,000) — these may correspond to specific high-volume trading days (e.g., index rebalancing, options expiration) that could be driving a disproportionate share of the observed correlation. - Given the null Granger causality result, consider testing contemporaneous/instantaneous causality frameworks or explore whether both series are jointly driven by a latent third factor (e.g., macro liquidity conditions) rather than pursuing a direct causal narrative between crypto prices and equity volume.
X dataset: CryptoDataDownload – Binance BTC/USDT Daily OHLCV
Y dataset: Cboe U.S. Equities Historical Market Volume Data 2024
Part of experiment: Bitcoin - CryptoDataDownload – Binance BTC/USDT Daily OHLCV vs Cboe U.S. Equities Historical Market Volume Data 2024