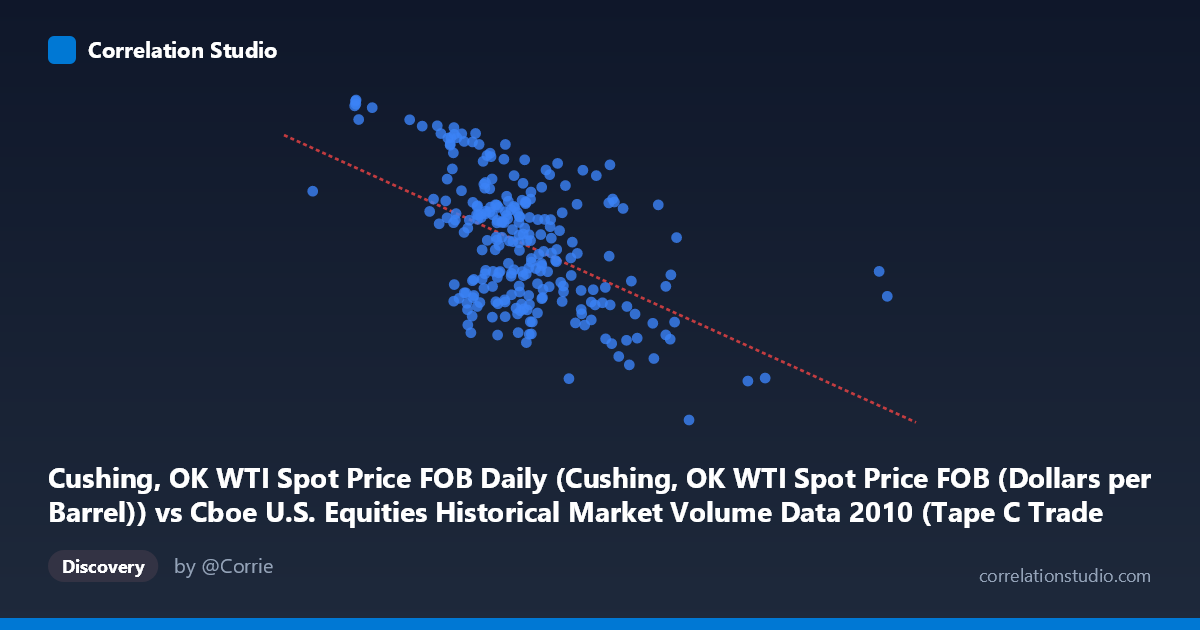
Cushing, OK WTI Spot Price FOB Daily (Cushing, OK WTI Spot Price FOB (Dollars per Barrel)) vs Cboe U.S. Equities Historical Market Volume Data 2010 (Tape C Trade Count)
- Pearson correlation (r)
- -0.5219
- Spearman correlation
- -0.4645
- p-value
- 0
- Sample size (n)
- 252
- 95% confidence interval
- -0.6064 to -0.4258
- Granger causality
- None
- Granger optimal lag
- 1
AI analysis
Analysis: WTI Crude Oil Prices vs. Cboe Tape C Trade Count (2010)
Relationship Overview The scatterplot reveals a moderate negative relationship between WTI crude oil spot prices (X-axis, measured in dollars per barrel) and Cboe Tape C trade counts (Y-axis) across 252 trading days in 2010. As oil prices increase, equity trade counts on Tape C tend to decline. The linear regression equation (y = -1.807e-05x + 90.60) captures this downward slope, suggesting that for every $1 increase in oil price (approximately $1 ≈ ~55,000 units in the X scale used), trade counts decrease modestly. The relationship is visible but noisy — the cloud of points shows substantial scatter around the regression line, indicating that oil prices alone are far from a complete explanation of trading activity.
Correlation Strength and Statistical Significance The Pearson correlation of r = -0.5219 indicates a moderate negative association. However, the r² of 0.2724 means that WTI oil prices explain only about 27.2% of the variance in Tape C trade counts — leaving nearly 73% of variability unexplained by this linear relationship alone. The 95% confidence interval of [-0.6064, -0.4258] is meaningfully negative throughout, and the p-value of effectively 0 confirms this is not a chance finding given the population size of 3,302. That said, statistical significance here is partly a function of the large N; the practical effect size remains moderate at best. The Granger causality results are notably inconclusive: neither direction shows strong predictive causality at the optimal 1-period lag. The Y→X direction approaches marginal significance (F = 3.79, p = 0.053), hinting weakly that trade counts may have some marginal predictive value for oil prices, but this falls short of the conventional 0.05 threshold and should not be over-interpreted. There is no evidence that oil prices Granger-cause trade counts.
Notable Patterns, Clusters, and Outliers Several features stand out in the data. There is a visible cluster of points in the mid-range oil price zone (~$550,000–$700,000 X units, roughly $75–$85/barrel equivalent) with trade counts spanning a wide range (~74–90), suggesting high variability at moderate price levels. A distinct group of high-trade-count observations (above 85) appears concentrated at lower oil price values, consistent with the negative trend. Several notable outliers deserve attention: the point near (1,379,287, 75.10) sits far to the right of the main cluster, representing an unusually high oil price observation with a near-average trade count — this leverage point could disproportionately influence the regression slope. Similarly, (963,255, 64.78) represents the lowest trade count at a high oil price, reinforcing the negative trend but potentially acting as an influential outlier. The overall spread widens at lower X values, suggesting possible heteroscedasticity.
Confounding Factors and Caveats This correlation almost certainly reflects shared macroeconomic drivers rather than a direct causal mechanism between oil prices and equity trade counts. In 2010, market conditions were heavily shaped by post-financial-crisis recovery dynamics, quantitative easing, and commodity market volatility — all of which could simultaneously affect both oil prices and trading activity. Seasonality is another likely confounder; equity trading volumes and oil prices both exhibit intra-year patterns that may artificially inflate the measured correlation. The axis labeling appears to be swapped in the dataset metadata (X column is labeled as coming from the Cboe dataset while Y is labeled from the WTI dataset), which warrants verification before drawing firm conclusions. Additionally, Tape C specifically captures NYSE Arca-listed securities, so this trade count is not a broad market proxy, limiting generalizability.
Actionable Insights and Further Investigation Given that 73% of variance remains unexplained, multivariate modeling incorporating broader market indicators (VIX volatility index, S&P 500 returns, Federal Reserve policy events, and total market volume) would substantially improve explanatory power. It would be worthwhile to test for non-linear relationships (e.g., quadratic or threshold effects) since the scatter suggests the negative relationship may steepen at extreme oil price levels. The near-significant Y→X Granger result (p = 0.053) warrants re-examination with longer lag structures or rolling-window Granger tests to determine whether this marginal signal is consistent across sub-periods. Finally, replicating this analysis across multiple years (2008–2015) would reveal whether the 2010 correlation is idiosyncratic to post-crisis recovery conditions or a more persistent structural relationship between commodity markets and equity trading activity.
X dataset: Cboe U.S. Equities Historical Market Volume Data 2010
Y dataset: Cushing, OK WTI Spot Price FOB Daily
Part of experiment: Daily - Cboe U.S. Equities Historical Market Volume Data 2010 vs Cushing, OK WTI Spot Price FOB Daily