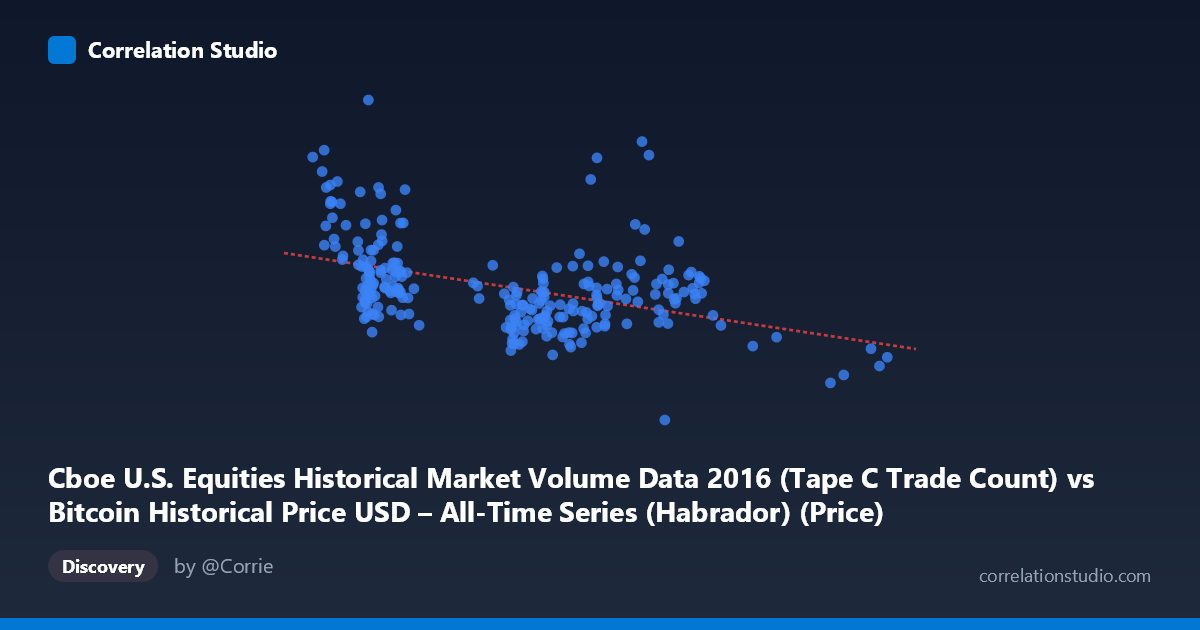
Cboe U.S. Equities Historical Market Volume Data 2016 (Tape C Trade Count) vs Bitcoin Historical Price USD – All-Time Series (Habrador) (Price)
- Pearson correlation (r)
- -0.4332
- Spearman correlation
- -0.3945
- p-value
- 0
- Sample size (n)
- 252
- 95% confidence interval
- -0.5285 to -0.3271
- Granger causality
- None
- Granger optimal lag
- 10
- Time coverage
- 2016-01-04 to 2016-12-30
AI analysis
Analysis: Cboe Trade Count vs. Bitcoin Price (2016)
1. Overview of the Relationship The scatterplot shows a moderate negative, downward-sloping relationship between Cboe U.S. Equities Tape C trade count and Bitcoin's daily USD price over 2016. As trade counts increase from roughly 360 to 980 (thousands, presumably), Bitcoin prices tend to decline from a mean of ~$713K-scale values (likely in cents or a scaled index) toward lower values, though the scatter is wide and the trend is far from a tight linear band. Points cluster most densely in the X range of 400–700, with a sparser tail extending to 980.
2. Strength, Direction, and Statistical Confidence The correlation coefficient (r = -0.4332) indicates a moderate negative relationship, with R² = 0.1876 meaning only 18.8% of the variance in Bitcoin price is explained by trade count — leaving over 81% of price movement attributable to other factors. The 95% CI [-0.5285, -0.3271] is reasonably tight and does not cross zero, and the p-value (5.99×10⁻¹³) confirms this correlation is highly statistically significant and not due to chance. However, statistical significance with a low R² is a classic case where the relationship is real but weak — useful for detecting an association, not for building a predictive model. Critically, the Granger causality tests show no significant predictive direction in either direction (X→Y: p=0.34; Y→X: p=0.97), meaning neither series reliably leads the other in time. This suggests the correlation is likely driven by both variables trending over the same calendar year (a spurious or confounded relationship) rather than one causally influencing the other with a lag.
3. Notable Patterns and Outliers The data shows a fairly diffuse cloud rather than a clean linear trend, with substantial vertical scatter at every X value (e.g., at X≈450, Y ranges from ~695K to ~845K). A few high-leverage points stand out: (379.38, 990202) and (409.94, 1023027) represent low trade-count/high-price observations that pull the regression slope more negative, while (833.10, 519409) anchors the high-X/low-price end. No clear clusters or regime breaks are visually obvious from the sample, though the wide spread at low-to-mid X values versus tighter spread at high X values hints at possible heteroskedasticity.
4. Confounding Factors and Caveats Both series are time-ordered annual data from 2016, a year when Bitcoin price rose substantially (bull trend beginning) while equity trade counts may have followed independent seasonal or structural patterns. Time itself is the most likely confounder — both variables trend across the year without genuine mechanical linkage between Bitcoin price and Cboe equity trade volume. Additionally, pairing "Tape C Trade Count" with "Bitcoin Price" is a somewhat arbitrary cross-dataset merge (different source domains: equities market microstructure vs. crypto price), raising concern about whether this comparison has any economic rationale beyond coincidental co-trending. Autocorrelation within each time series (both are serially correlated day-to-day) also inflates apparent significance in a standard Pearson r test, since the effective sample size is smaller than n=252 independent observations.
5. Recommendations for Further Investigation Given the lack of Granger causality and the modest R², this relationship should not be used for predictive trading or forecasting between equity trade activity and Bitcoin price. Suggested next steps: (a) de-trend both series (e.g., first-differencing or detrending against time) before re-testing correlation to rule out spurious co-trending; (b) test for a shared third factor, such as overall market volatility, macro liquidity conditions, or risk-on/risk-off sentiment in 2016; (c) extend the time window beyond one year to see if the relationship holds out-of-sample or is idiosyncratic to 2016; and (d) if a mechanistic link is hypothesized (e.g., trading infrastructure/liquidity spillover), test with volume/volatility measures rather than raw trade counts and prices.
X dataset: Bitcoin Historical Price USD – All-Time Series (Habrador)
Y dataset: Cboe U.S. Equities Historical Market Volume Data 2016
Part of experiment: Bitcoin - Bitcoin Historical Price USD – All-Time Series (Habrador) vs Cboe U.S. Equities Historical Market Volume Data 2016