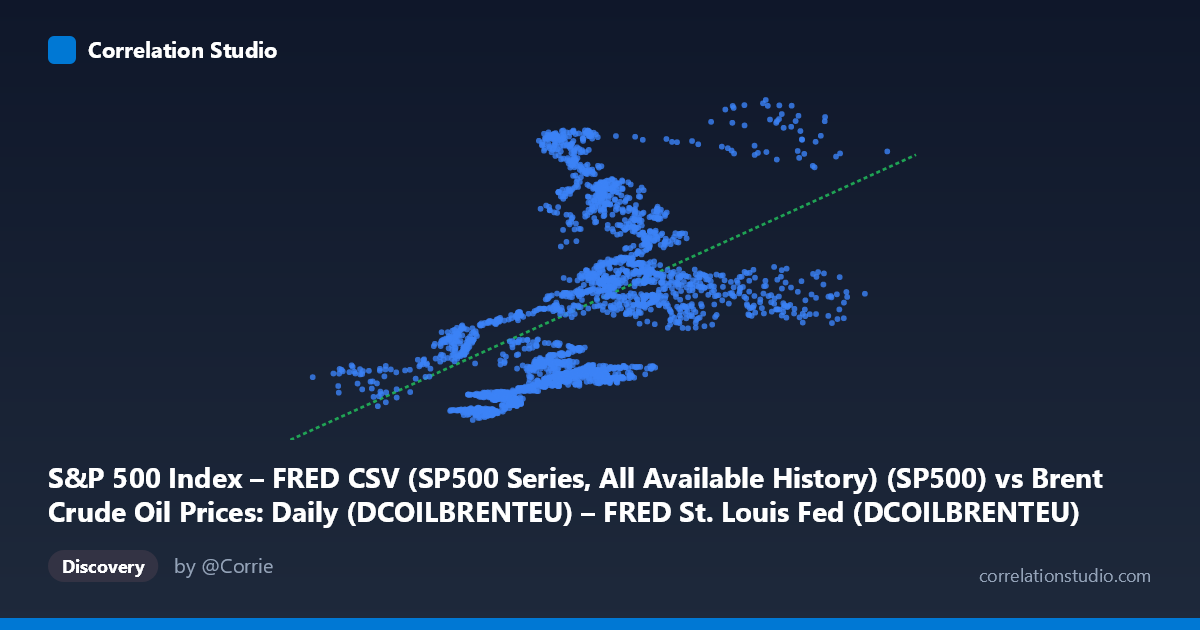
S&P 500 Index – FRED CSV (SP500 Series, All Available History) (SP500) vs Brent Crude Oil Prices: Daily (DCOILBRENTEU) – FRED St. Louis Fed (DCOILBRENTEU)
- Pearson correlation (r)
- 0.4795
- Spearman correlation
- 0.5862
- p-value
- 0
- Sample size (n)
- 2475
- 95% confidence interval
- 0.4485 to 0.5093
- Granger causality
- None
- Granger optimal lag
- 9
AI analysis
S&P 500 vs. Brent Crude Oil: Correlation Analysis
1. Overall Relationship
The scatterplot reveals a positive but diffuse relationship between Brent Crude Oil prices (X-axis, USD/barrel) and S&P 500 index values (Y-axis). As crude oil prices rise, S&P 500 values tend to increase as well, consistent with the linear regression slope of ~34.87 — meaning each additional dollar per barrel in Brent crude is associated with roughly 35 index points in the S&P 500. However, the wide vertical spread of data points at virtually every X value makes clear that this relationship is far from deterministic. The data spans roughly a decade (May 2016 to May 2026), capturing multiple distinct economic regimes including the COVID-19 crash, post-pandemic recovery, and inflationary cycles — all of which contribute to the substantial scatter visible throughout the plot.
2. Correlation Strength and Statistical Interpretation
The Pearson correlation of r = 0.4795 indicates a moderate positive association, but the explanatory power is notably limited. The R² of 0.2299 means that Brent crude prices explain only about 23% of the variance in S&P 500 levels, leaving approximately 77% of the variation attributable to other factors entirely. The 95% confidence interval of [0.4485, 0.5093] is relatively narrow given the large sample (n = 2,475), and the p-value of effectively zero confirms the correlation is highly statistically significant — but statistical significance here should not be confused with practical predictive power. The Granger causality results are particularly telling: neither direction (X→Y: F=1.56, p=0.12; Y→X: F=0.97, p=0.46) reaches significance at the 9-period optimal lag, meaning Brent crude prices do not reliably predict future S&P 500 movements, and vice versa. This decouples statistical correlation from any actionable temporal forecasting relationship.
3. Notable Patterns, Clusters, and Non-Linear Features
Several distinct structural features emerge from the sample points and broader data distribution. There is a visible lower cluster of points concentrated roughly between X = 40–60 (low oil prices) and Y = 2,000–3,500 (lower S&P values), likely corresponding to the 2016–2017 period and the 2020 oil price collapse. A second denser cloud forms around X = 65–90 and Y = 3,500–5,500, reflecting the post-2021 normalization period. Critically, the Spearman ρ exceeding Pearson r flags a non-linear relationship — a logarithmic or polynomial fit would likely outperform the linear model. Several prominent high-leverage outliers are visible: points like (67.25, 6587.47), (69.13, 6092.18), and (119.03, 6824.66) sit well above the regression line, suggesting that the S&P 500 reached historically elevated levels at both moderate and high oil price ranges, which a simple linear model cannot adequately capture.
4. Confounding Factors and Caveats
Interpreting this correlation requires significant caution. Both variables are strongly trended over time — the S&P 500 has been in a secular bull market while oil prices have undergone multiple boom-bust cycles — meaning much of the observed correlation may be spurious co-movement driven by shared macroeconomic time trends rather than any genuine causal link. Federal Reserve monetary policy, USD strength, global GDP growth, and geopolitical events (e.g., Russia-Ukraine conflict affecting both oil supply and equity markets simultaneously) are powerful confounders that could generate or suppress correlation between these series depending on the period examined. Additionally, the 10-year licensing cap on S&P 500 data means the dataset begins in 2016, excluding the pre-2016 period when oil-equity correlations behaved quite differently (often negatively correlated during supply shocks). The non-linearity flagged by Spearman ρ also suggests the relationship changes character across different oil price regimes, making a single linear coefficient potentially misleading.
5. Actionable Insights and Further Investigation
Given the moderate correlation, limited explained variance, and absence of Granger causality, Brent crude alone is insufficient as a standalone predictor of S&P 500 levels for trading or forecasting purposes. Several avenues warrant further investigation: (a) Regime-segmented analysis — splitting the data by period (pre/post-COVID, high/low inflation regimes) would likely reveal that the correlation is highly unstable and context-dependent; (b) Non-linear modeling — fitting a logarithmic or piecewise regression could meaningfully improve on the 23% R², particularly given the Spearman signal; (c) Multivariate modeling — incorporating USD index, Fed Funds rate, and VIX alongside oil prices would test whether crude retains independent explanatory power after controlling for confounders; (d) Sector-level decomposition — energy sector equities within the S&P 500 are directly tied to oil prices, so disaggregating the index would clarify whether the correlation is broad-based or driven by a narrow component.
X dataset: Brent Crude Oil Prices: Daily (DCOILBRENTEU) – FRED St. Louis Fed
Y dataset: S&P 500 Index – FRED CSV (SP500 Series, All Available History)
Part of experiment: Daily - Brent Crude Oil Prices: Daily (DCOILBRENTEU) – FRED St. Louis Fed vs S&P 500 Index – FRED CSV (SP500 Series, All Available History)