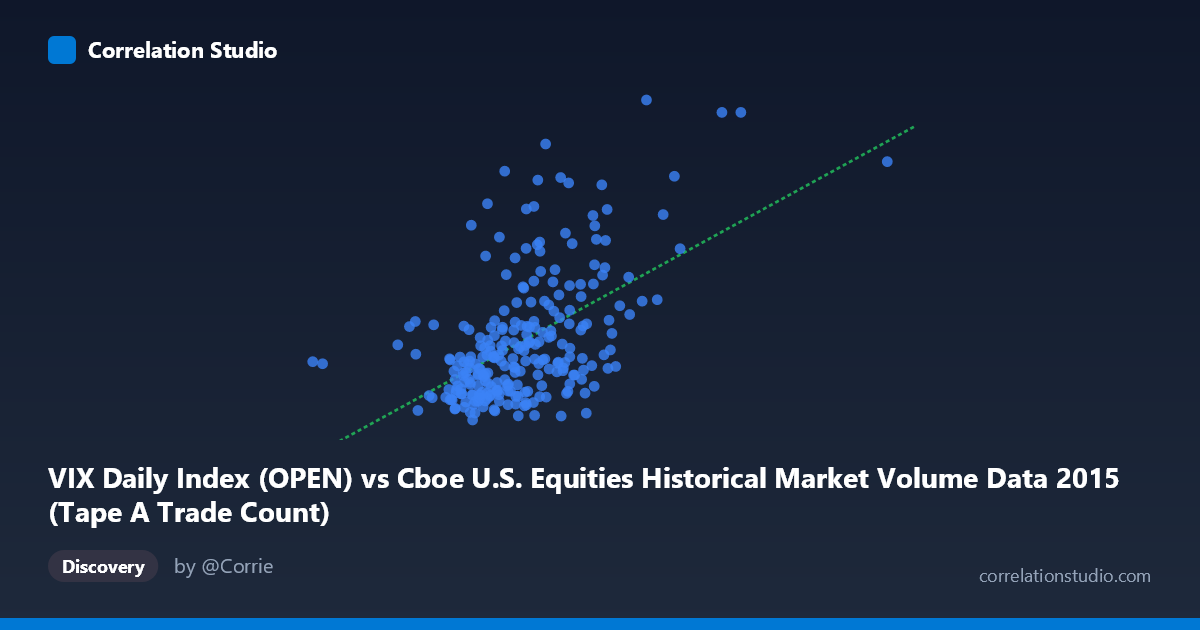
VIX Daily Index (OPEN) vs Cboe U.S. Equities Historical Market Volume Data 2015 (Tape A Trade Count)
- Pearson correlation (r)
- 0.5379
- Spearman correlation
- 0.4807
- p-value
- 0
- Sample size (n)
- 252
- 95% confidence interval
- 0.4438 to 0.6202
- Granger causality
- None
- Granger optimal lag
- 1
AI analysis
Scatterplot Analysis: VIX Daily Index (Open) vs. Tape A Trade Count
Overall Relationship
The scatterplot reveals a moderate positive relationship between the VIX Daily Index opening values and Cboe U.S. Equities Tape A Trade Count across 2015. As VIX levels rise — indicating greater implied market volatility — trade counts tend to increase, which aligns intuitively with the well-established market behavior that elevated uncertainty drives higher trading activity. The linear regression equation (y = 8.43×10⁻⁶x + 4.66) captures this upward trend, though the scatter around the regression line is considerable, signaling that VIX alone is far from a complete explanation of trading volume dynamics.
Correlation Strength and Statistical Framing
The Pearson correlation of r = 0.538 indicates a moderate positive association, but the r² of 0.289 is the more sobering figure: only 28.9% of the variance in Tape A Trade Count is explained by VIX open levels. The remaining ~71% is attributable to other factors entirely. The 95% confidence interval [0.44, 0.62] is reasonably tight given n = 252, and the p-value of effectively zero confirms the correlation is statistically significant and not a sampling artifact. However, the Granger causality results tell a critical story: neither direction of temporal predictive causality is significant (X→Y: F = 0.019, p = 0.890; Y→X: F = 0.013, p = 0.910). This means that knowing today's VIX does not meaningfully help predict tomorrow's trade count, and vice versa — the correlation reflects contemporaneous co-movement rather than a leadlag predictive relationship.
Notable Patterns, Clusters, and Outliers
The sample points reveal notable clustering in the moderate VIX range (~1.1M–1.6M on X, 12–18 on Y), consistent with typical 2015 market conditions. Several high-leverage outliers stand out: the point at approximately (2,247,816, 31.13) represents an extreme combination of high trade volume and elevated VIX, likely corresponding to a period of acute market stress such as the August 2015 volatility spike. Similarly, (1,360,511, 27.43) and (1,495,738, 26.87) suggest episodic surges. At the other extreme, the point (576,208, 15.44) is a clear low-volume outlier on the X-axis — possibly a holiday-shortened session — yet carries a near-average VIX, which weakens the linear fit at the tails.
Confounding Factors and Caveats
Several important caveats apply. First, reverse labeling appears in the dataset metadata — the VIX series is labeled as the X-axis source while Tape A Trade Count is drawn from the VIX dataset, which may reflect a data joining artifact and warrants verification. Second, both variables are likely driven by common underlying factors such as macroeconomic news events, Federal Reserve announcements, and earnings seasons, making this a classic case of spurious correlation through shared confounders rather than direct causation. Third, the relationship may be non-linear at extremes — during true market crises, trade counts can spike disproportionately relative to VIX levels, violating linear regression assumptions. The single-year (2015) time window also limits generalizability.
Actionable Insights and Further Investigation
Practitioners should treat VIX as a rough contemporaneous signal of trading activity rather than a predictive tool for scheduling or capacity planning. Given the unexplained 71% variance, incorporating additional predictors — such as day-of-week effects, earnings calendar density, and macroeconomic announcement schedules — into a multivariate model would substantially improve explanatory power. It would also be worthwhile to test for non-linear (e.g., threshold) effects, since the outliers suggest the relationship may steepen sharply above VIX levels of ~25. Finally, replicating this analysis across multiple years would test whether the 2015 correlation holds structurally or was period-specific, particularly given that 2015 contained the unusual August volatility event.
X dataset: Cboe U.S. Equities Historical Market Volume Data 2015
Y dataset: VIX Daily Index
Part of experiment: Daily - Cboe U.S. Equities Historical Market Volume Data 2015 vs VIX Daily Index