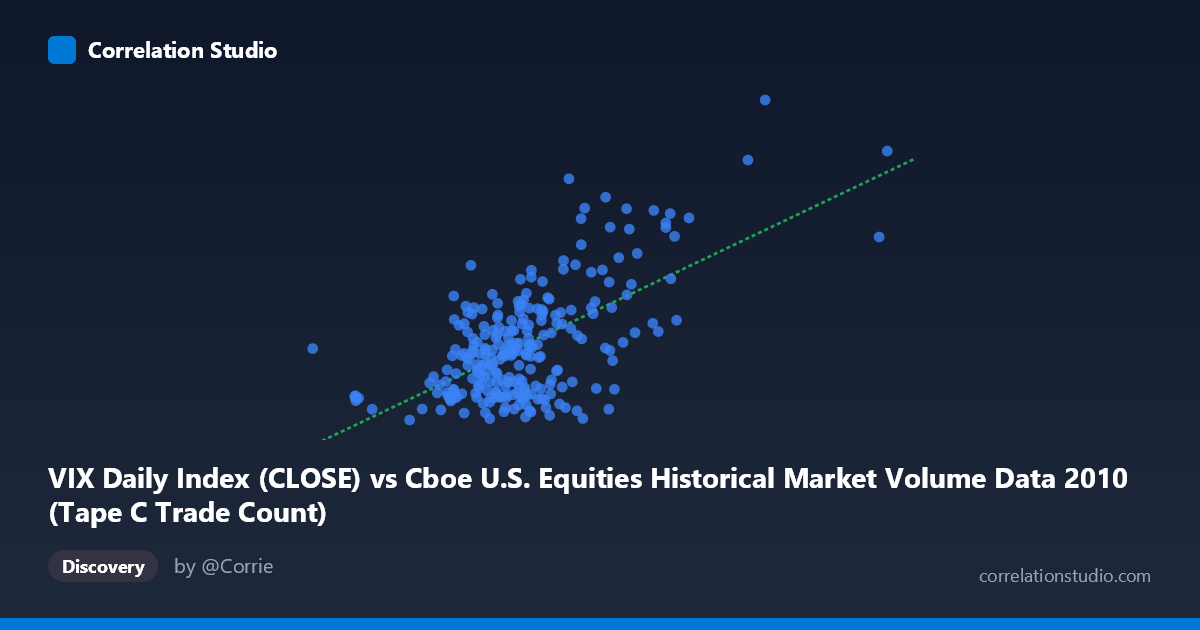
VIX Daily Index (CLOSE) vs Cboe U.S. Equities Historical Market Volume Data 2010 (Tape C Trade Count)
- Pearson correlation (r)
- 0.6185
- Spearman correlation
- 0.4453
- p-value
- 0
- Sample size (n)
- 252
- 95% confidence interval
- 0.5359 to 0.6894
- Granger causality
- Y → X
- Granger optimal lag
- 1
AI analysis
Scatterplot Analysis: VIX vs. Tape C Trade Count (2010)
Relationship Overview The scatterplot reveals a moderate positive relationship between the CBOE Volatility Index (VIX) closing values and Tape C trade counts in U.S. equity markets during 2010. As VIX rises — indicating elevated market fear or uncertainty — the number of trades on Tape C (NYSE Arca-listed securities) tends to increase correspondingly. This makes intuitive sense: periods of high volatility typically drive heightened trading activity as investors reposition, hedge, or react to rapidly changing market conditions. The linear regression equation (y = 2.15×10⁻⁵x + 9.313) confirms a positive slope, though the relationship is clearly not perfectly linear across the full range of observed values.
Correlation Strength and Statistical Significance The Pearson correlation of r = 0.619 reflects a moderate-to-strong positive association, but the explained variance — r² = 0.383 — is the more sobering metric: only about 38% of the variation in Tape C trade counts is attributable to VIX levels, leaving the majority of variance unexplained by this single predictor. The 95% confidence interval of [0.536, 0.689] is relatively tight given the sample size (n = 252), and the p-value of essentially zero confirms this relationship is not a statistical artifact. More consequentially, the Granger causality analysis points unidirectionally: Y (Tape C trade count) Granger-causes X (VIX), not the reverse. The Y→X result is statistically significant (F = 7.27, p = 0.008) at a 1-period lag, while X→Y falls short of conventional significance (F = 2.96, p = 0.087). This means past trade volume activity is a better temporal predictor of subsequent VIX levels than VIX is of future trading volume — a subtle but important reversal of the assumed causal narrative.
Patterns, Clusters, and Outliers The data cloud displays notable heteroscedasticity: observations cluster densely in the lower-left region (VIX roughly 15–25, lower trade counts), with dispersion increasing markedly at higher VIX values. Several high-leverage points in the upper-right — including the observation near (1,379,287; 40.95) and another near (1,086,790; 40.10) — appear to be strong drivers of the overall correlation. A handful of points show high VIX but relatively modest trade counts (e.g., ~795,000 VIX-units with only ~16 trade count), suggesting the relationship breaks down in specific market episodes. The spread at intermediate VIX values (20–30) is particularly wide, indicating that volatility alone is an inconsistent predictor of trading activity in that regime.
Confounding Factors and Caveats Several important caveats temper this analysis. First, the Granger causality direction suggests model specification matters greatly — using VIX to "predict" trade volume may be conceptually backwards. Second, 2010 was a structurally unusual year, encompassing the Flash Crash of May 6, post-financial-crisis normalization, and significant ETF/algorithmic trading growth, all of which could introduce regime-dependent behavior not captured by a single linear model. Third, Tape C specifically covers NYSE Arca securities (heavily ETF-weighted), meaning this relationship may reflect ETF arbitrage mechanics — where volatility spikes trigger index rebalancing flows — rather than broad market participation. Fourth, the large population size (N = 3,302) versus the paired sample (n = 252) warrants scrutiny about sampling methodology and potential selection bias.
Actionable Insights and Further Investigation Given that trade count Granger-causes VIX, practitioners could explore using unusual surges in Tape C activity as a leading indicator for volatility regime changes, potentially useful for options pricing or risk management triggers. Further analysis should consider: (1) non-linear models (e.g., logarithmic or piecewise regression) given the visible heteroscedasticity; (2) isolating Flash Crash dates to assess whether the outlier cluster is regime-specific; (3) multivariate modeling incorporating other volume tapes, bid-ask spreads, or market breadth to improve the unexplained 62% of variance; and (4) extending the time series beyond 2010 to test whether this Granger-causal structure is stable across different volatility regimes, particularly in low-VIX environments like 2017 or stress periods like 2020.
X dataset: Cboe U.S. Equities Historical Market Volume Data 2010
Y dataset: VIX Daily Index
Part of experiment: Daily - Cboe U.S. Equities Historical Market Volume Data 2010 vs VIX Daily Index