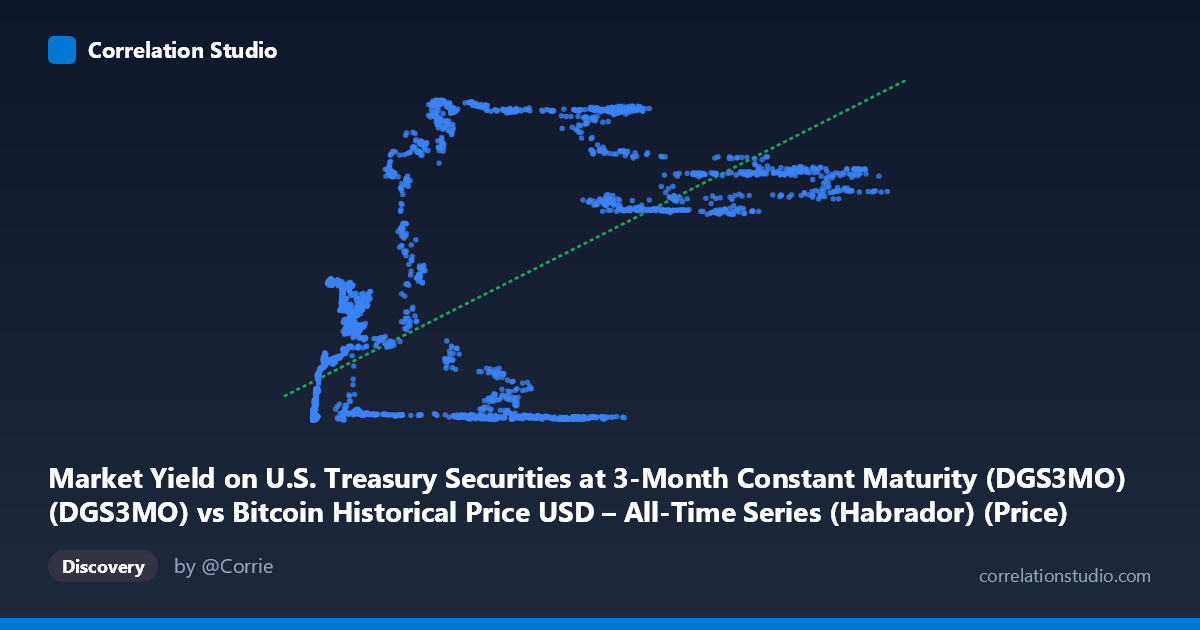
Market Yield on U.S. Treasury Securities at 3-Month Constant Maturity (DGS3MO) (DGS3MO) vs Bitcoin Historical Price USD – All-Time Series (Habrador) (Price)
- Pearson correlation (r)
- 0.6655
- Spearman correlation
- 0.6569
- p-value
- 0
- Sample size (n)
- 4042
- 95% confidence interval
- 0.648 to 0.6823
- Granger causality
- None
- Granger optimal lag
- 1
- Time coverage
- 2010-07-19 to 2026-09-15
- Recomputed on refreshed data
- 2026-10-24 (r was 0.6655)
AI analysis
Analysis: Bitcoin Price vs. 3-Month Treasury Yield
1. What the Visualization Reveals
Despite the axis labels appearing swapped in the metadata (X is described as Treasury yield but ranges to 124,720, clearly Bitcoin price; Y is described as Bitcoin price but ranges 0–5.63, clearly a yield in percent), the underlying relationship being examined is between Bitcoin's price trajectory and the 3-month T-bill yield. The scatterplot shows a rough positive association: as Bitcoin price climbs into the tens of thousands of dollars, the associated yield values cluster higher (often in the 4–5.5% range), while at low Bitcoin prices (under ~$1,000), yields are compressed near zero. However, the relationship is far from a clean line — it looks more like two or three distinct regimes or clusters rather than a continuous trend.
2. Strength, Direction, and Statistical Meaning
The correlation (r = 0.652) is moderate-to-strong and positive, with r² = 0.425 indicating that only 42.5% of the variance in one variable is explained by the other — meaning more than half the variation is driven by other factors. The 95% CI [0.633, 0.669] is tight, and p ≈ 0 confirms this correlation is not a statistical fluke given the large sample (n=3,946). However, the Granger causality tests are critical here: neither direction (X→Y or Y→X) shows significant predictive causality (p = 0.39 both ways). This means the correlation is almost certainly a spurious or confounded relationship rather than one variable driving the other over time — both series likely responded to a shared macro backdrop (e.g., the 2020–2023 rate-hiking cycle coinciding with a Bitcoin bull run) rather than one causing the other.
3. Notable Patterns and Clusters
The data clearly separates into regimes: a large cluster near the origin (low price, near-zero yield — the 2010–2015 and 2020 zero-rate era), and a second cluster at high Bitcoin prices ($50,000–$125,000) paired with elevated yields (4–5.5%), reflecting 2023–2025 when the Fed aggressively raised rates while Bitcoin simultaneously rallied. Notably, there are "outlier" points like (56,973, 0.06) and (40,162, 0.03) where Bitcoin price is high but yield is near zero, and (18,869, 4.66) where yield is high but price is comparatively low — these likely represent transitional periods (rate-cut cycles or price crashes) that break the apparent linear trend and reveal the relationship is regime-dependent, not continuous.
4. Confounding Factors and Caveats
The most obvious confound is time itself: both series are trending over a 2010–2026 window, and both happen to have risen over the last ~3 years due to unrelated causes (Fed monetary tightening post-COVID inflation vs. Bitcoin's post-halving adoption cycle). This is a classic case of spurious correlation between two non-stationary time series — a well-known statistical trap. Additionally, Bitcoin's multi-year bull/bear cycles and the Fed's discrete rate-hike/cut regimes create step-function-like behavior in both variables, which can inflate linear correlation without implying any economic linkage.
5. Actionable Insights
Given the lack of Granger causality, this correlation should not be used for predictive trading or hedging strategies — one series does not lead the other. Analysts should instead: (a) difference or detrend both series (e.g., analyze % changes rather than levels) to test for a "true" relationship stripped of shared trend; (b) test cointegration formally rather than relying on Pearson r, which is misleading for trending series; and (c) investigate a third common driver (Fed policy stance, inflation expectations, or risk-on/risk-off sentiment) that may simultaneously affect both Bitcoin valuations and short-term rates, rather than assuming a direct link between yields and crypto prices.
X dataset: Bitcoin Historical Price USD – All-Time Series (Habrador)
Y dataset: Market Yield on U.S. Treasury Securities at 3-Month Constant Maturity (DGS3MO)
Part of experiment: Bitcoin - Bitcoin Historical Price USD – All-Time Series (Habrador) vs Market Yield on U.S. Treasury Securities at 3-Month Constant Maturity (DGS3MO)