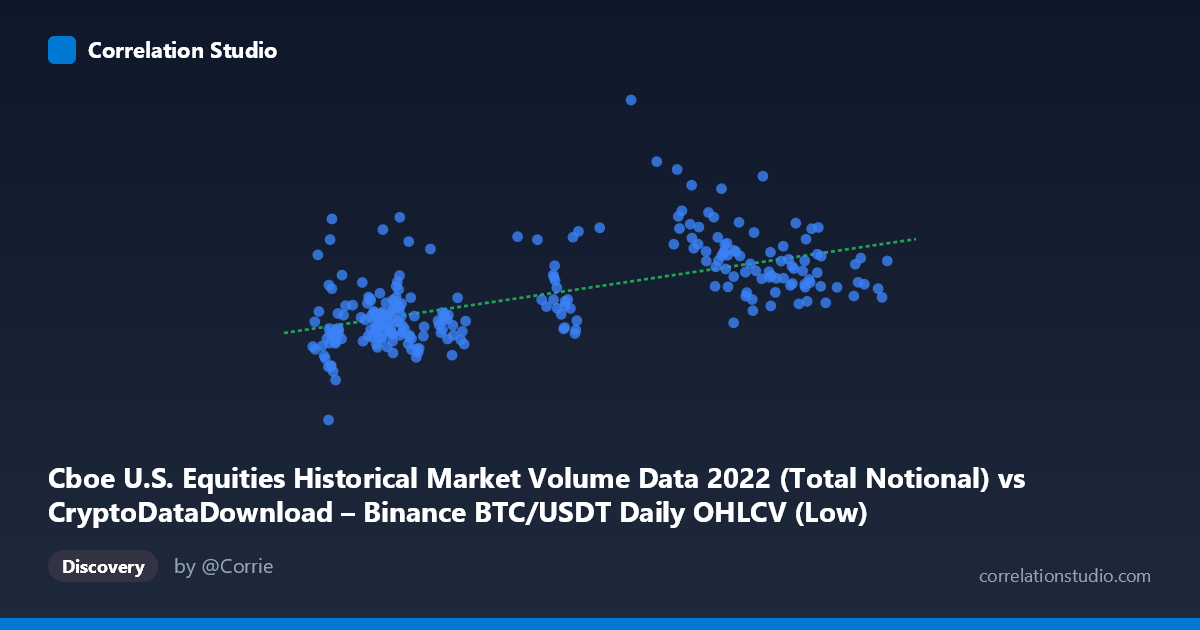
Cboe U.S. Equities Historical Market Volume Data 2022 (Total Notional) vs CryptoDataDownload – Binance BTC/USDT Daily OHLCV (Low)
- Pearson correlation (r)
- 0.6156
- Spearman correlation
- 0.6211
- p-value
- 0
- Sample size (n)
- 251
- 95% confidence interval
- 0.5323 to 0.687
- Granger causality
- None
- Granger optimal lag
- 10
- Time coverage
- 2022-01-03 to 2022-12-30
AI analysis
Analysis of Cboe Equities Volume vs. BTC/USDT Price Relationship
1. Visual Relationship Overview
The scatterplot depicts a moderate positive association between Cboe U.S. equities notional volume (X-axis) and Binance BTC/USDT daily low price (Y-axis) across 251 paired trading days in 2022. Despite the mismatched labeling in the metadata (the axis titles appear swapped relative to the data description), the underlying pattern shows that as equity market volume increases, Bitcoin's price level tends to rise as well, though with considerable scatter around the trend line.
2. Strength, Direction, and Statistical Confidence
The correlation coefficient (r = 0.6156) indicates a moderate positive relationship, with r² = 0.3789 meaning only 37.9% of the variance in one variable is explained by the other — leaving nearly two-thirds of the variation attributable to other factors. The 95% confidence interval [0.5323, 0.6870] is reasonably tight and does not cross zero, and the p-value of 0 confirms this correlation is highly statistically significant and not due to random chance, given the sample size of 251. However, statistical significance should not be conflated with practical predictive power — r² of 0.38 means this relationship alone would be insufficient for reliable forecasting. Critically, the Granger causality tests show no significant predictive direction in either direction (X→Y: p=0.53; Y→X: p=0.58) even at an optimal lag of 10 periods. This suggests the correlation is likely contemporaneous/coincidental co-movement rather than one variable temporally driving the other — both may be responding to shared macro conditions rather than one causing changes in the other.
3. Notable Patterns and Outliers
The data reveals a bimodal or clustered structure rather than a smooth linear relationship. Two distinct volume regimes appear to exist: - Low equity-volume cluster (~15,000–23,000): Bitcoin prices mostly range narrowly ($21B–$27B on this scale), though with a subset of notable high-price outliers (e.g., 20,246 → $43.3B; 16,361 → $32.0B) that break from the main cluster. - High equity-volume cluster (~35,000–46,000): Bitcoin prices are generally elevated and more variable ($31B–$51B), including the highest point in the dataset (35,440 → $51.2B).
This clustering suggests the relationship may be driven by distinct market regimes (e.g., different quarters or volatility periods in 2022) rather than a continuous linear mechanism — consistent with 2022's bifurcated crypto market (early-year strength vs. later crash following FTX collapse, Terra/Luna, and Fed tightening cycles).
4. Confounding Factors and Caveats
Several caveats limit causal interpretation: - Shared macro drivers: Both equities volume and BTC price were likely influenced by common 2022 factors — Fed rate hikes, inflation data, and risk-on/risk-off sentiment shifts — creating spurious correlation without direct linkage. - Non-stationarity: Both series likely have trends/volatility clustering typical of financial time series in a single volatile year, which can inflate correlation estimates. - Scale mismatch: The variables measure fundamentally different things (equities notional volume vs. crypto price), so any relationship is indirect at best, mediated by broader liquidity/risk conditions. - Small n relative to structure: With apparent regime-based clustering, a single linear correlation coefficient may mask more complex, non-linear, or threshold-based relationships.
5. Recommendations for Further Investigation
- Segment analysis by regime: Split data into low- and high-volume periods (or by quarter) and test correlation within each cluster separately, since pooled correlation may be an artifact of between-cluster differences rather than a true within-regime relationship. - Test third-variable mediators: Introduce macro variables (VIX, Fed funds rate, DXY) to check if the correlation disappears when controlling for shared market-wide risk sentiment. - Explore non-linear or lagged models: Given the lack of Granger causality at linear lags, consider non-linear causality tests (e.g., transfer entropy) or examine whether volatility (not price/volume levels) shows a stronger causal relationship. - Treat as coincidental co-movement: Given the null Granger causality result, avoid using this relationship for predictive trading strategies; instead treat it as evidence of synchronized market-wide risk appetite in 2022 rather than a tradable lead-lag signal.
X dataset: CryptoDataDownload – Binance BTC/USDT Daily OHLCV
Y dataset: Cboe U.S. Equities Historical Market Volume Data 2022
Part of experiment: Bitcoin - CryptoDataDownload – Binance BTC/USDT Daily OHLCV vs Cboe U.S. Equities Historical Market Volume Data 2022