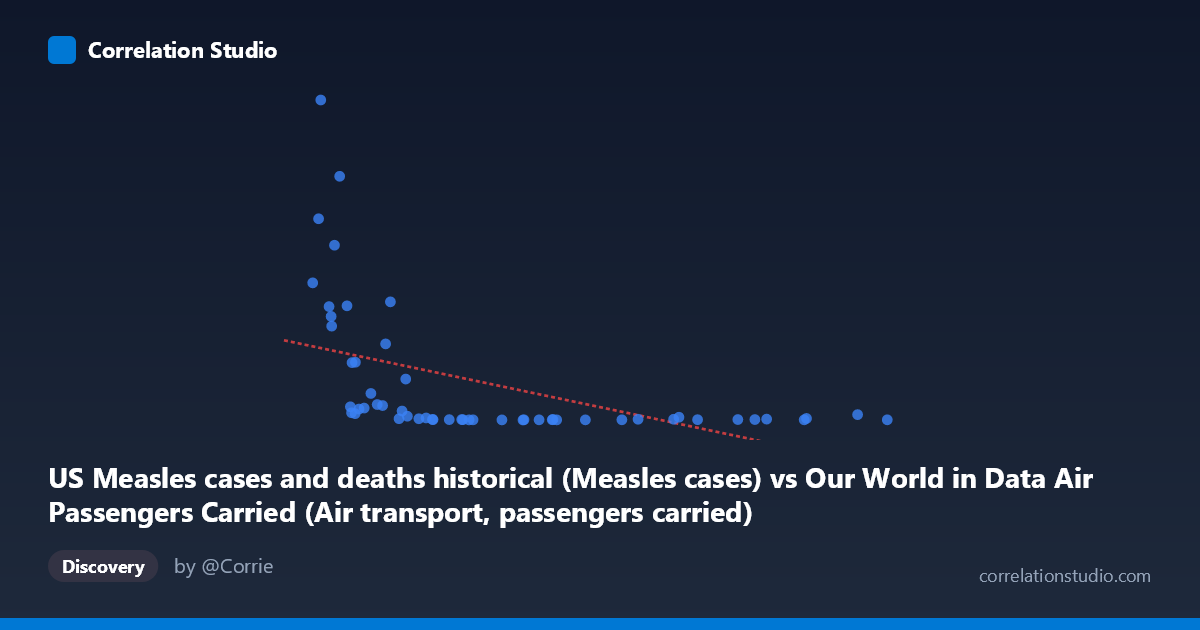
US Measles cases and deaths historical (Measles cases) vs Our World in Data Air Passengers Carried (Air transport, passengers carried)
- Pearson correlation (r)
- -0.4876
- Spearman correlation
- -0.7824
- p-value
- 0.000184
- Sample size (n)
- 54
- 95% confidence interval
- -0.6681 to -0.2528
- Granger causality
- None
- Granger optimal lag
- 10
AI analysis
Analysis: US Measles Cases vs. Air Passengers Carried
1. What the Visualization Reveals
The scatterplot displays a negative relationship between US measles cases (X-axis) and air transport passengers carried (Y-axis), spanning data from 1970 to 2023. The overall pattern shows that as measles cases increase, passenger volumes tend to be lower, and conversely, periods of very high air travel correspond with dramatically reduced measles case counts. However, the relationship is far from uniform — the data points are heavily clustered at lower measles case counts with a wide spread in passenger numbers, while higher measles case counts are associated with a narrower, lower range of passenger figures. This asymmetric distribution strongly hints at a non-linear rather than strictly linear relationship.
2. Correlation Strength, Direction, and Statistical Framing
The Pearson correlation of r = -0.4876 indicates a moderate negative association, but the R² of 0.2377 means only ~23.8% of the variance in air passengers is explained by measles case counts — leaving roughly 76% of variance attributable to other factors. The 95% confidence interval for r spans [-0.6681, -0.2528], a fairly wide range that nonetheless excludes zero entirely, and the p-value of 0.0001845 confirms this is statistically significant well below the conventional 0.05 threshold. That said, the notable gap between Spearman ρ and Pearson r signals that the linear model is not the best fit — a logarithmic or power-law model would likely capture the relationship more faithfully. Critically, the Granger causality analysis shows no significant predictive directionality in either direction (X→Y: p = 0.337; Y→X: p = 0.557), meaning that knowing measles case counts does not help forecast future passenger volumes, nor vice versa, even at the optimal lag of 10 periods.
3. Notable Patterns, Clusters, and Outliers
Several features stand out immediately. There is a dense cluster of points with X values below ~30 million measles cases and Y values below ~10,000 passengers, representing more recent decades where both measles was largely eliminated and air travel surged. A handful of extreme outliers command attention: (9,856,569; 75,290) and (14,007,604; 57,345) represent very high passenger counts paired with relatively modest (but still elevated) measles cases, likely reflecting transition-era years. At the opposite extreme, points like (54,260,201; 13) and (49,637,676; 37) show massive measles case burdens with negligible air passengers — consistent with pre-aviation-era data. The regression line (y = -0.000227x + 19,167) visually undersells the steep drop-off at the low-measles end, reinforcing the non-linear signal.
4. Confounding Factors and Interpretation Caveats
This correlation is almost certainly spurious, driven by a shared underlying temporal trend rather than any mechanistic link between measles and air travel. Both variables are strongly time-dependent: measles cases declined dramatically through the 20th century due to vaccination (1963 introduction of the measles vaccine) and public health campaigns, while air passengers grew exponentially due to economic development, deregulation, and globalization. The dataset spans 1970–2023 with N=105 population points, meaning both series are riding long secular trends in opposite directions. Additionally, the datasets originate from entirely different domains (epidemiology vs. transport economics), the measles data is US-specific while air passengers are likely global, and the 10-period optimal lag in Granger testing may simply reflect the slow pace of both trends rather than any causal mechanism. The wide confidence interval and the non-linear signal further caution against over-interpreting the r value.
5. Actionable Insights and Further Investigation
Given the strong temporal confounding, the most productive next step would be to detrend both series (e.g., first-differencing or applying a Hodrick-Prescott filter) before re-evaluating correlation — if the association disappears after detrending, the relationship is purely artifactual. It would also be worthwhile to fit a logarithmic or power-law regression given the Spearman/Pearson divergence, which may better characterize the non-linear shape visible in the cluster structure. More analytically meaningful questions might explore whether air travel correlates with measles importation events in specific outbreak years, or whether increased international passengers predicts measles resurgence after elimination — a more mechanistically defensible hypothesis that would also require country-level rather than aggregate data. Finally, controlling for year as a covariate in a partial correlation analysis would directly test whether any residual association persists beyond the shared time trend.
X dataset: Our World in Data Air Passengers Carried
Y dataset: US Measles cases and deaths historical
Part of experiment: Yearly - Our World in Data Air Passengers Carried vs US Measles cases and deaths historical