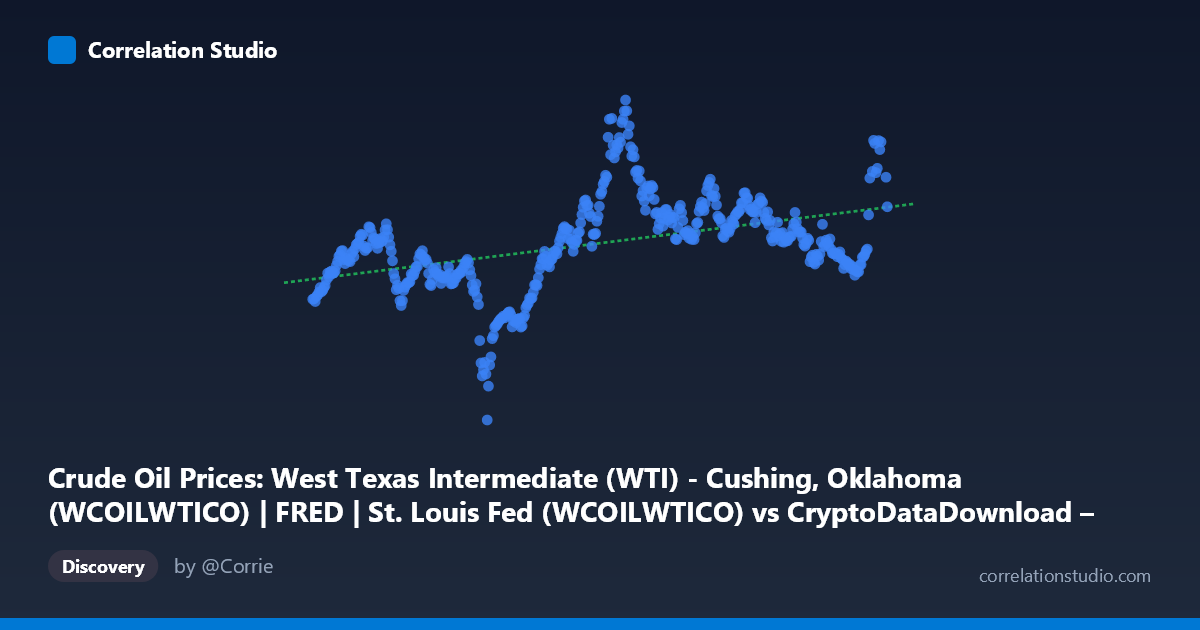
Crude Oil Prices: West Texas Intermediate (WTI) - Cushing, Oklahoma (WCOILWTICO) | FRED | St. Louis Fed (WCOILWTICO) vs CryptoDataDownload – Binance BTC/USDT Daily OHLCV (Unix)
- Pearson correlation (r)
- 0.4362
- Spearman correlation
- 0.5
- p-value
- 0
- Sample size (n)
- 458
- 95% confidence interval
- 0.3589 to 0.5075
- Granger causality
- None
- Granger optimal lag
- 1
- Time coverage
- 2017-08-18 to 2026-06-19
- Recomputed on refreshed data
- 2026-10-09 (r was 0.4362)
AI analysis
Analysis: WTI Crude Oil Prices vs. Time (2017–2026)
(Note: Despite the axis labels appearing swapped in the metadata, the actual data structure represents WTI crude oil price (Y-axis, $3.32–$120.43) plotted against time/date (X-axis, converted from Unix timestamps spanning 2017–2026). This analysis treats it accordingly.)
1. What the Visualization Reveals
The scatterplot shows WTI crude oil prices over an approximately nine-year window (2017–2026), capturing significant volatility rather than a clean trend. Prices range widely from near $3 (almost certainly reflecting the historic April 2020 negative/near-zero oil price collapse) up to $120, with a mean around $68. The data show clustering in the $50–80 range for most of the period, punctuated by a dramatic dip (2020) and a sharp spike above $100 (visible in 2022 data points, e.g., values of 110–116 around mid-2022).
2. Strength, Direction, and Statistical Confidence
The correlation coefficient (r = 0.436) indicates a moderate positive relationship, with R² = 0.190 meaning only 19% of the variance in oil prices is explained by the linear time trend — the remaining 81% is driven by other factors (geopolitical events, OPEC decisions, demand shocks, etc.). The 95% confidence interval [0.359, 0.508] is reasonably tight given n=458, and the p-value ≈ 0 confirms this modest correlation is statistically robust, not due to chance. However, statistical significance here reflects a weak-to-moderate secular upward drift in prices over time, not a strong predictive relationship. The Granger causality tests show no significant predictive direction (X→Y p=0.706; Y→X p=0.447), meaning past values in this pairing don't meaningfully forecast future values at lag 1 — consistent with oil prices behaving as a largely exogenous, event-driven series rather than one with simple autoregressive time-dependency captured by this model.
3. Notable Patterns and Outliers
Several distinct regimes are visible: - 2020 collapse: Prices near $3–40 reflect COVID-19 demand destruction and the unprecedented negative-pricing event. - 2021–2022 surge: Sharp climb to $100+ coinciding with post-pandemic demand recovery and the Russia-Ukraine war's supply shock (values like 110.96, 116.37, 99.92). - 2023–2026 moderation: Prices settle back into a $60–85 band, suggesting market stabilization.
This is a classic non-linear, regime-shifting pattern — the linear model (y = 9.44e-11x − 86.99) poorly captures these structural breaks, explaining the low R².
4. Confounding Factors and Caveats
Oil prices are influenced by numerous confounders not captured in a simple time-based regression: OPEC+ production quotas, geopolitical conflicts, US shale output, currency (USD) strength, seasonal demand, and global recession risks. Additionally, treating "time" as the predictor conflates all these causal drivers into a single proxy, meaning the moderate correlation likely reflects a long-term inflationary/structural drift rather than a meaningful causal mechanism. The dataset's odd cross-referencing with BTC/USDT OHLCV metadata also suggests possible data-alignment issues worth verifying.
5. Recommendations
Given the low explanatory power and regime-shifting behavior, linear time-trend modeling is inadequate for forecasting WTI prices. Analysts should: (1) segment the series into structural regimes (pre-COVID, COVID-shock, post-invasion, stabilization) for piecewise analysis; (2) incorporate exogenous variables (OPEC supply data, USD index, inventory levels) rather than relying on time alone; (3) apply volatility-aware models (GARCH) given the evident heteroskedasticity; and (4) double check the dataset alignment/labeling, since the axis descriptions suggest a mismatch between the crude oil and BTC datasets that should be resolved before drawing further conclusions.
X dataset: CryptoDataDownload – Binance BTC/USDT Daily OHLCV
Y dataset: Crude Oil Prices: West Texas Intermediate (WTI) - Cushing, Oklahoma (WCOILWTICO) | FRED | St. Louis Fed
Part of experiment: Bitcoin - CryptoDataDownload – Binance BTC/USDT Daily OHLCV vs Crude Oil Prices: West Texas Intermediate (WTI) - Cushing, Oklahoma (WCOILWTICO) | FRED | St. Louis Fed