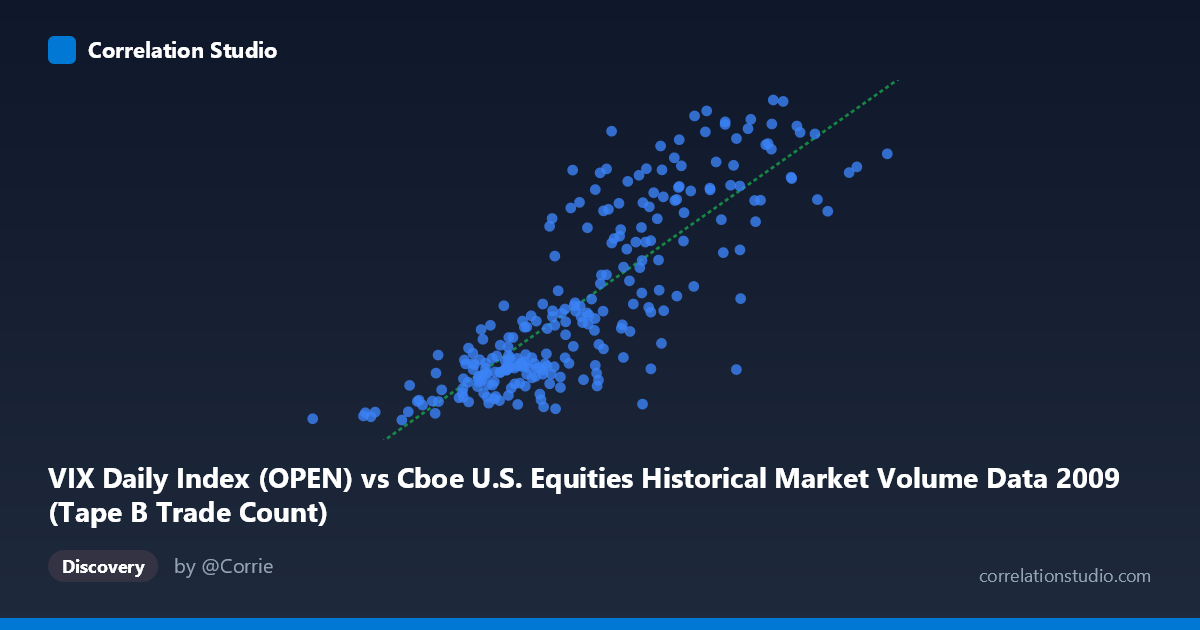
VIX Daily Index (OPEN) vs Cboe U.S. Equities Historical Market Volume Data 2009 (Tape B Trade Count)
- Pearson correlation (r)
- 0.8272
- Spearman correlation
- 0.8279
- p-value
- 0
- Sample size (n)
- 252
- 95% confidence interval
- 0.7838 to 0.8626
- Granger causality
- None
- Granger optimal lag
- 1
AI analysis
Scatterplot Analysis: VIX Open vs. Tape B Trade Count (2009)
Overall Relationship The scatterplot reveals a moderately strong positive relationship between the VIX Daily Index (Open) and the Tape B Trade Count across U.S. equities exchanges in 2009. As the VIX opens higher — reflecting greater implied market volatility — Tape B trade counts tend to rise in tandem. This is visually intuitive: periods of heightened fear or uncertainty in equity markets historically drive elevated trading activity across exchange venues, including those capturing Tape B securities (primarily NYSE American and regional exchange-listed equities). The linear regression line (y = 6.10×10⁻⁵x + 7.24) captures this upward trend reasonably well across the observed range.
Correlation Strength and Statistical Framing The Pearson correlation of r = 0.827 indicates a strong positive association. More meaningfully, r² = 0.684 tells us that approximately 68.4% of the variance in Tape B Trade Count is explained by the VIX open level — a substantial explanatory share for a single-variable relationship in financial market data. The 95% confidence interval of [0.784, 0.863] is notably narrow given the sample of n = 252, and the p-value of effectively zero confirms this is not a chance finding across the N = 3,232 population. However, the Granger causality tests tell a critical story: neither direction (X→Y nor Y→X) achieves significance (F < 0.01, p 0.94 in both cases). This means that while the two variables are strongly correlated contemporaneously, neither reliably predicts the other one period ahead. The relationship is associative, not temporally predictive — a crucial distinction for any trading or operational application.
Notable Patterns, Clusters, and Outliers The data exhibits clear clustering behavior. A dense cluster occupies the lower-left region (VIX open roughly 81,000–400,000; Trade Count ~19–28), representing calmer, lower-volatility trading sessions. A second, more dispersed cluster populates the upper-right quadrant (VIX open ~450,000–766,000; Trade Count ~37–52), corresponding to high-volatility, high-activity days — likely coinciding with market stress events in 2009, such as the March equity market trough and subsequent sharp recovery. Several notable outliers appear: the point near (766,764, 47.08) represents the highest VIX open value but a relatively moderate trade count, slightly undercutting the linear trend, while points near (600,722, 49.68) and (659,003, 49.96) sit above the regression line. A few mid-range VIX observations (e.g., ~591,944 mapping to only 32.10) suggest meaningful residual variance at higher VIX levels.
Confounding Factors and Caveats Several important caveats apply. First, 2009 was an extraordinary year — spanning the tail of the global financial crisis and a dramatic recovery — meaning the VIX range sampled (~82K–767K) reflects regime-level shifts rather than typical intra-year variation, which may inflate the correlation. Second, Tape B trade count is influenced by factors entirely independent of volatility, including exchange fee structures, algorithmic routing decisions, regulatory changes, and secular growth in electronic trading, all of which were in flux in 2009. Third, the axis labels appear to reflect a possible unit or scaling ambiguity: VIX is typically quoted in single- or double-digit figures, so values in the hundreds of thousands suggest these may be raw index units, notional values, or a differently scaled derivative measure — users should verify the data units carefully. Finally, the absence of Granger causality despite a high r² suggests a common driver (e.g., macroeconomic stress events, news shocks) is simultaneously lifting both variables, rather than one causing the other.
Actionable Insights and Further Investigation Practitioners should resist treating this correlation as a predictive signal for next-day trade routing or volume forecasting, given the Granger null result. Instead, the relationship is most useful for contemporaneous regime classification — high VIX open days can serve as a reliable signal that Tape B activity will be elevated that same day, informing intraday capacity planning and liquidity provision strategies. To deepen the analysis, researchers should: (1) decompose by sub-period (Q1 crisis vs. Q2–Q4 recovery) to test whether the correlation holds symmetrically across market regimes; (2) test non-linear specifications (logarithmic or piecewise regression) given the apparent clustering; (3) introduce control variables such as overall market volume, news sentiment indices, or Fed announcement dates to isolate the VIX's marginal contribution; and (4) extend to multiple years to assess whether this 2009 relationship is crisis-specific or structurally persistent.
X dataset: Cboe U.S. Equities Historical Market Volume Data 2009
Y dataset: VIX Daily Index
Part of experiment: Daily - Cboe U.S. Equities Historical Market Volume Data 2009 vs VIX Daily Index