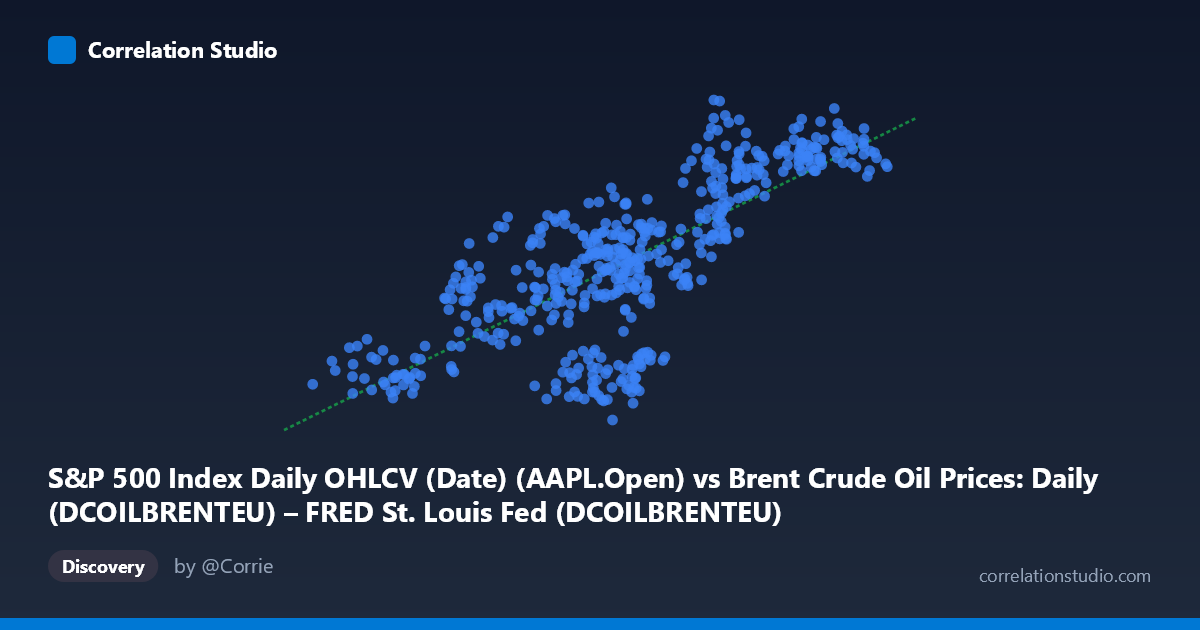
S&P 500 Index Daily OHLCV (Date) (AAPL.Open) vs Brent Crude Oil Prices: Daily (DCOILBRENTEU) – FRED St. Louis Fed (DCOILBRENTEU)
- Pearson correlation (r)
- 0.7621
- Spearman correlation
- 0.7552
- p-value
- 0
- Sample size (n)
- 504
- 95% confidence interval
- 0.7228 to 0.7964
- Granger causality
- None
- Granger optimal lag
- 1
AI analysis
Scatterplot Analysis: AAPL Opening Price vs. Brent Crude Oil Price (2015–2017)
Relationship Overview
The scatterplot reveals a moderately strong positive relationship between Apple's (AAPL) opening stock price and Brent Crude Oil spot prices over the two-year period from February 2015 to February 2017. As AAPL's opening price increases from roughly $26 to $66, Brent Crude tends to rise from approximately $90 to $136 per barrel. The linear regression equation (y = 1.004x + 64.47) suggests an almost one-to-one unit relationship on the surface, though this numerical coincidence masks a more complex underlying dynamic. The general upward trend is visible across the scatter, but considerable dispersion around the regression line indicates the relationship is far from deterministic.
Correlation Strength and Statistical Interpretation
The Pearson correlation of r = 0.762 indicates a moderately strong positive association, but the more informative metric is R² = 0.581: only about 58% of the variance in Brent Crude prices is explained by AAPL's opening price, leaving 42% attributable to other factors entirely. The 95% confidence interval of [0.723, 0.796] is relatively narrow given the large sample (n = 504), and the p-value of essentially zero confirms this correlation is highly statistically significant — not a chance artifact. However, statistical significance does not imply practical or causal meaning. Critically, the Granger causality tests fail in both directions (X→Y: F = 0.006, p = 0.938; Y→X: F = 0.384, p = 0.536), meaning neither variable reliably predicts the other temporally at a one-period lag. This firmly rules out any straightforward predictive or leading-indicator relationship between the two series.
Notable Patterns, Clusters, and Outliers
The sample points reveal several notable structural features. There is a visible cluster of points in the mid-range (AAPL ~$44–50, Brent ~$100–115) suggesting a prolonged period where both variables traded in tandem within stable ranges — likely reflecting a shared macro environment. A second cluster emerges in the upper right (AAPL ~$57–66, Brent ~$124–136), representing periods of simultaneous recovery or growth. A few points stand out as potential outliers: the observation near (54.16, 135.67) sits notably above the regression line, and (46.08, 93.48) sits well below it, suggesting episodic divergences where one variable moved independently of the other. Some heteroscedasticity also appears plausible — variance in Brent prices seems to widen slightly at higher AAPL price levels.
Confounding Factors and Caveats
The most important caveat here is the classic spurious correlation problem: both AAPL stock price and Brent Crude Oil prices are time-series variables that share a common temporal trend over 2015–2017. Both broadly declined in late 2015/early 2016 and recovered through 2016–2017, likely driven by shared macroeconomic forces — global growth expectations, USD strength, Federal Reserve policy, and broad risk-on/risk-off sentiment cycles — rather than any direct linkage between a tech company's equity and an energy commodity. The dataset labels also suggest possible metadata misalignment: the X-axis is labeled as originating from the Brent Crude dataset but contains AAPL open prices, which warrants verification of data pipeline integrity. Additionally, with daily data, autocorrelation within each series inflates the effective sample size, potentially overstating the precision of the confidence interval.
Actionable Insights and Further Investigation
Given the absence of Granger causality, practitioners should not use AAPL prices to forecast Brent Crude (or vice versa) in any trading or risk model — the correlation is likely a shared macro artifact. Recommended next steps include: (1) conducting a cointegration test (e.g., Engle-Granger) to determine if a stable long-run equilibrium exists between the series; (2) detrending or differencing both series to remove shared temporal drift and re-examining whether residual correlation persists; (3) introducing common macro controls (e.g., DXY dollar index, VIX, S&P 500 broad index) to isolate whether the apparent relationship vanishes under multivariate analysis; and (4) extending the time window beyond 2017 to test whether the correlation is period-specific and regime-dependent. The finding is academically interesting as an illustration of spurious correlation in financial data, but should not be operationalized without substantially deeper causal investigation.
X dataset: Brent Crude Oil Prices: Daily (DCOILBRENTEU) – FRED St. Louis Fed
Y dataset: S&P 500 Index Daily OHLCV (Date)
Part of experiment: Daily - Brent Crude Oil Prices: Daily (DCOILBRENTEU) – FRED St. Louis Fed vs S&P 500 Index Daily OHLCV (Date)