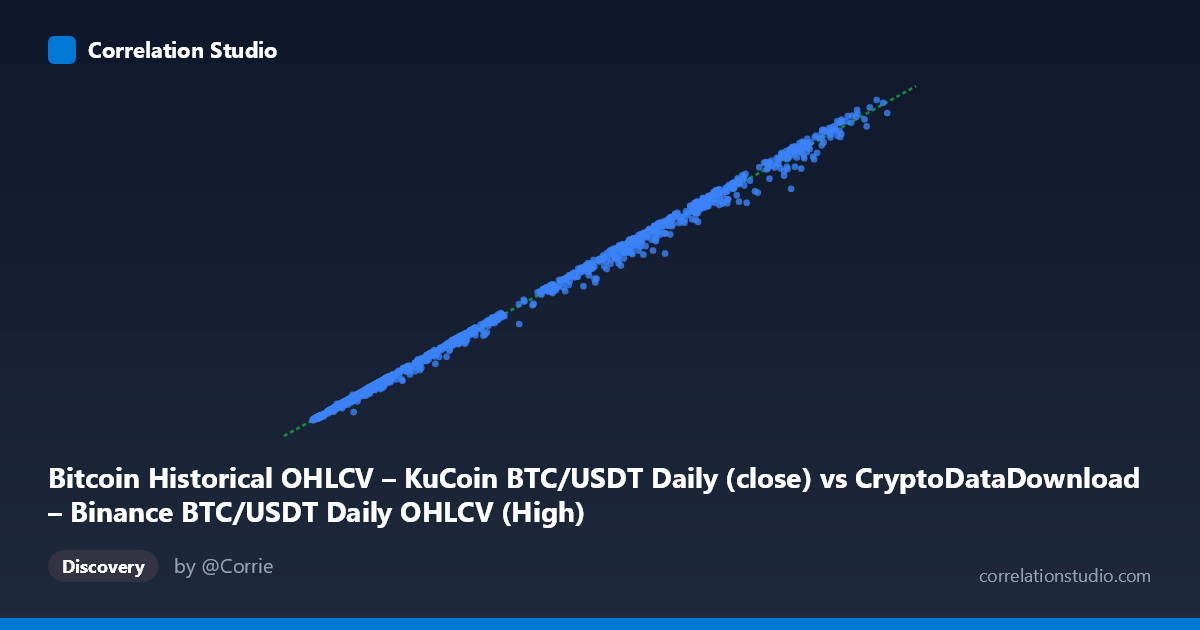
Bitcoin Historical OHLCV – KuCoin BTC/USDT Daily (close) vs CryptoDataDownload – Binance BTC/USDT Daily OHLCV (High)
- Pearson correlation (r)
- 0.9992
- Spearman correlation
- 0.9987
- p-value
- 0
- Sample size (n)
- 1861
- 95% confidence interval
- 0.9991 to 0.9993
- Granger causality
- None
- Granger optimal lag
- 10
- Time coverage
- 2017-10-19 to 2022-11-29
AI analysis
Analysis: Bitcoin Price Cross-Exchange Comparison (Binance vs. KuCoin)
1. Relationship Overview
This scatterplot compares BTC/USDT daily closing prices on Binance (X-axis) against daily high prices on KuCoin (Y-axis) from October 2017 through November 2022. The data points trace an almost perfectly straight diagonal line across the full price range (~$3,200 to ~$69,000), reflecting the fact that both series represent the same underlying asset (Bitcoin) priced in the same quote currency (USDT) on two competing but arbitrage-linked exchanges.
2. Strength, Direction, and Predictive Structure
The correlation is essentially maximal: r = 0.9992, r² = 0.9984, meaning 99.84% of the variance in KuCoin's high price is statistically explained by Binance's close price. The 95% CI [0.9991, 0.9993] is extremely tight given the large sample (n=1,861), and the p-value of 0 (effectively <10⁻¹⁰⁰) confirms this relationship is not a product of chance. The regression line (y ≈ 0.972x + 8.33) has a slope near 1.0 and a negligible intercept, consistent with two near-identical price series rather than a causal economic relationship between distinct phenomena.
Notably, the Granger causality tests show no significant predictive direction in either direction (X→Y: p=0.45; Y→X: p=0.48) at the optimal lag of 10 periods. This is expected: cross-exchange arbitrage keeps prices synchronized in near real-time, so neither exchange's price leads the other in any exploitable daily-lag sense — they move together contemporaneously rather than one driving the other over time.
3. Patterns, Clusters, and Outliers
The scatter is remarkably linear across all price regimes, from the sub-$10k cluster of 2018–2019 data through the $40k–$69k range of the 2021 bull run, with no visible curvature, heteroskedasticity, or regime breaks. A few points show minor deviations from the line — e.g., (32162.59, 29101.50), (7975.00, 7079.86), (45200.00, 42803.90) — where the Y value sits noticeably below the fitted line. These likely correspond to days with brief cross-exchange price dislocations (flash crashes, liquidity gaps, or KuCoin-specific volatility spikes) where arbitrage temporarily lagged. The consistent slight positive offset of X over Y in these outliers suggests occasional short-lived discounts on KuCoin relative to Binance.
4. Confounding Factors and Caveats
Because both variables measure the same asset, this is fundamentally a measurement redundancy correlation rather than a relationship between independent economic variables — the near-r=1 result is expected and not analytically surprising. Caveats include: (a) comparing a "close" price to a "high" price introduces a small systematic asymmetry (highs are ≥ closes intraday), (b) daily aggregation masks intraday arbitrage lags and volume-driven divergences, (c) time-coverage spans multiple volatility regimes (2018 bear market, 2020 COVID crash, 2021 bull run, 2022 crash) which could mask regime-specific relationship changes if analyzed at finer granularity, and (d) no volume or liquidity data is included, which typically drives the size of cross-exchange spreads.
5. Actionable Insights
Given the redundancy, this comparison is best used for data quality/arbitrage monitoring rather than forecasting. Suggested next steps: (1) analyze the residuals (X−Y or the outlier points) directly to identify specific dates of cross-exchange dislocation, which could reveal arbitrage opportunities or exchange-specific liquidity events; (2) re-run Granger causality on higher-frequency (hourly/minute) data, where genuine lead-lag microstructure effects between exchanges are more likely to emerge; (3) incorporate volume/spread data to model liquidity-driven divergence during high-volatility periods (e.g., the 2022 crash) rather than relying on price alone.
X dataset: CryptoDataDownload – Binance BTC/USDT Daily OHLCV
Y dataset: Bitcoin Historical OHLCV – KuCoin BTC/USDT Daily
Part of experiment: Bitcoin - CryptoDataDownload – Binance BTC/USDT Daily OHLCV vs Bitcoin Historical OHLCV – KuCoin BTC/USDT Daily