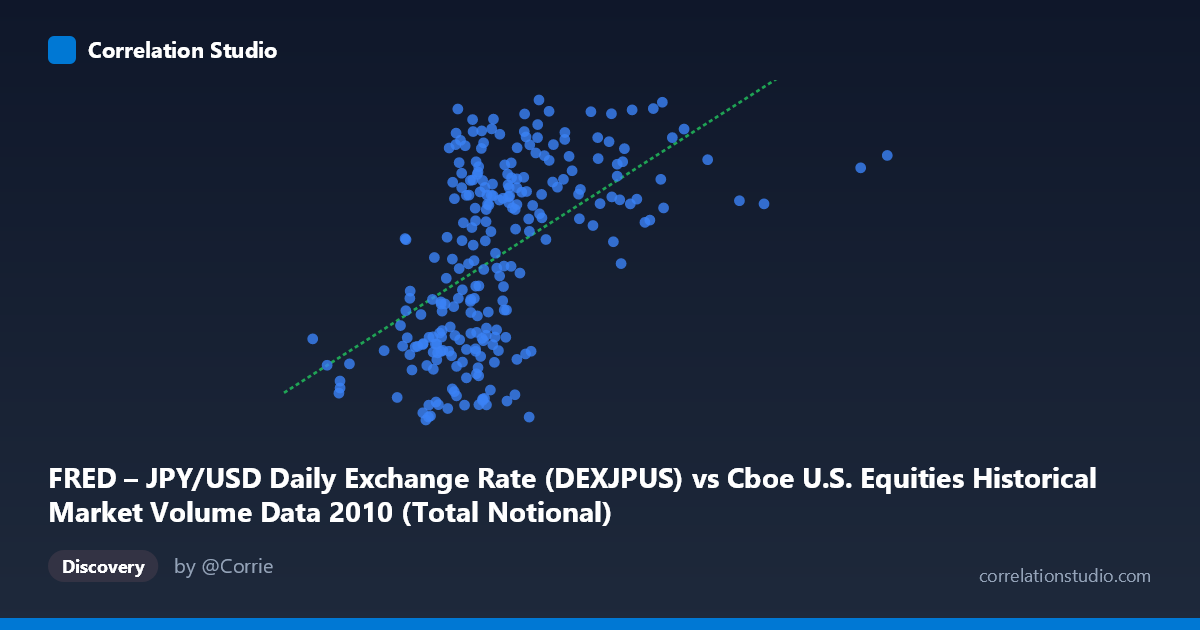
FRED – JPY/USD Daily Exchange Rate (DEXJPUS) vs Cboe U.S. Equities Historical Market Volume Data 2010 (Total Notional)
- Pearson correlation (r)
- 0.5428
- Spearman correlation
- 0.5813
- p-value
- 0
- Sample size (n)
- 249
- 95% confidence interval
- 0.4488 to 0.625
- Granger causality
- None
- Granger optimal lag
- 1
AI analysis
Scatterplot Analysis: JPY/USD Exchange Rate vs. Cboe U.S. Equities Total Notional Volume (2010)
Relationship Overview
The scatterplot reveals a moderate positive association between the JPY/USD daily exchange rate (X-axis) and total notional volume on U.S. equities exchanges (Y-axis) across 249 trading days in 2010. As the yen-per-dollar exchange rate increases — meaning the dollar strengthens relative to the yen — total notional trading volume on U.S. equity markets tends to be higher. The linear regression equation (y = 4.21×10⁻¹⁰x + 80.06) confirms this upward slope, though the wide spread of points around the regression line immediately signals that this relationship is far from deterministic. The data cluster most densely in the X range of roughly 13–22 billion (JPY/USD values in the mid-to-upper 80s range), with a visible upward trend embedded within considerable scatter.
Correlation Strength and Statistical Significance
The Pearson correlation of r = 0.543 indicates a moderate positive relationship, but the more informative metric is r² = 0.2947, meaning that roughly 29.5% of the variance in total notional volume is explained by the JPY/USD exchange rate. This leaves approximately 70.5% of the variance unexplained, attributable to other market forces. The 95% confidence interval for r of [0.449, 0.625] is meaningfully above zero throughout, and the p-value of effectively 0 (given N = 3,302) confirms this correlation is highly statistically significant and not a chance artifact. However, statistical significance here must be interpreted carefully given the large population size — even weak effects become statistically detectable at N 3,000. Critically, Granger causality tests find no significant temporal predictive direction in either direction (X→Y: F = 0.78, p = 0.38; Y→X: F = 0.39, p = 0.53), meaning neither variable reliably predicts the other one period ahead. This is a meaningful constraint: the correlation is contemporaneous and associative, not predictive or directional in a causal temporal sense.
Notable Patterns, Clusters, and Outliers
Several structural features are visible in the data. The bulk of observations form a loose upward-sloping cloud concentrated between X values of ~12–22 billion and Y values of ~82–93, suggesting a fairly stable trading regime for most of 2010. There are notable outliers at the upper X range — points exceeding 28–44 billion in notional volume — which appear to pull the regression line upward and likely correspond to specific high-volatility or high-volume trading episodes (e.g., flash crash period in May 2010). At the lower X extreme, a visible isolated cluster near X ≈ 6–7 billion (e.g., the point at ~6.74B, 82.91) sits well to the left of the main distribution, suggesting these may represent anomalous low-activity sessions. There is also mild evidence of heteroscedasticity — variance in Y appears somewhat wider at moderate X values than at the extremes — which could modestly undermine the linear regression assumptions.
Confounding Factors and Interpretive Caveats
The apparent correlation between the JPY/USD rate and U.S. equity notional volume is almost certainly driven by shared macroeconomic conditions rather than any direct mechanism between these two variables. In 2010, major global risk events — including the European sovereign debt crisis, the May 6 Flash Crash, and Federal Reserve quantitative easing decisions — simultaneously influenced both currency markets and equity trading activity. Risk-off episodes tend to strengthen the yen (lower JPY/USD) while also suppressing equity volumes, which could create a spurious positive correlation through a common driver. Additionally, the dataset labeling appears transposed in the metadata (X-axis labeled as FRED JPY/USD but described under Cboe volume, and vice versa), which warrants verification before drawing firm conclusions. The single optimal lag of 1 period used in Granger testing may also be insufficient to capture longer structural dynamics between these markets.
Actionable Insights and Further Investigation
Given the moderate but causally unconfirmed relationship, the most productive next steps would be to introduce explicit control variables — particularly VIX (volatility index), S&P 500 returns, and Federal Reserve policy indicators — to test whether the JPY/USD-to-volume correlation persists after accounting for shared risk sentiment drivers. Researchers should also extend the Granger causality analysis to lags of 5–20 periods to capture weekly-scale dynamics, as daily lag-1 tests may miss meaningful lead-lag structures. Segmenting the data by pre- and post-Flash Crash periods (before/after May 6, 2010) could reveal whether the correlation is regime-dependent rather than stable throughout the year. Finally, comparing this 2010 relationship against other years would help determine whether this is a period-specific artifact of post-financial crisis conditions or a more durable structural feature of the JPY/USD and U.S. equity market relationship.
X dataset: Cboe U.S. Equities Historical Market Volume Data 2010
Y dataset: FRED – JPY/USD Daily Exchange Rate
Part of experiment: Daily - Cboe U.S. Equities Historical Market Volume Data 2010 vs FRED – JPY/USD Daily Exchange Rate