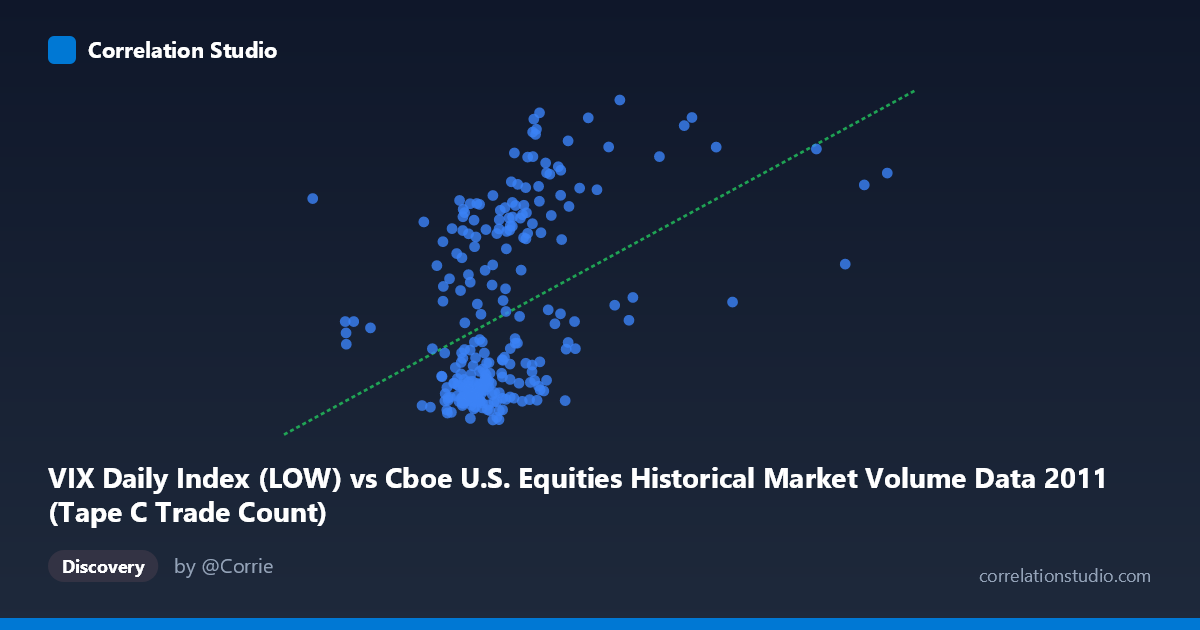
VIX Daily Index (LOW) vs Cboe U.S. Equities Historical Market Volume Data 2011 (Tape C Trade Count)
- Pearson correlation (r)
- 0.4242
- Spearman correlation
- 0.4296
- p-value
- 0
- Sample size (n)
- 252
- 95% confidence interval
- 0.3173 to 0.5205
- Granger causality
- None
- Granger optimal lag
- 1
AI analysis
Scatterplot Analysis: VIX Low vs. Tape C Trade Count (2011)
Relationship Overview The scatterplot reveals a moderate positive relationship between the VIX Daily Index Low values (X-axis) and the Cboe U.S. Equities Tape C Trade Count (Y-axis) across 252 trading days in 2011. As VIX low readings increase — indicating elevated baseline volatility — Tape C trade counts tend to rise correspondingly. The linear regression equation (y = 2.658E-05x + 8.604) confirms this upward trend, though the scatter around the regression line is considerable, suggesting the relationship is real but far from deterministic. Visually, the bulk of observations cluster in a lower-left region with a diffuse tail extending toward higher values on both axes, hinting at a distribution that is not uniformly spread.
Correlation Strength and Statistical Significance The Pearson correlation of r = 0.4242 indicates a moderate positive association, but the explanatory power is modest: r² = 0.18 means that only 18% of the variance in Tape C trade counts is explained by VIX low levels, leaving 82% attributable to other factors. The 95% confidence interval [0.317, 0.521] is meaningfully above zero and relatively tight given n = 252, reinforcing that this is a genuine signal rather than noise. The p-value of 1.98E-12 is extraordinarily small, confirming strong statistical significance at the population level (N = 3,780). However, statistical significance should not be conflated with practical importance — the modest r² tempers enthusiasm. Critically, the Granger causality tests find no significant predictive direction in either direction (X→Y: F = 0.205, p = 0.651; Y→X: F = 0.034, p = 0.855), meaning that past VIX low values do not help forecast future trade counts, and vice versa. The relationship appears contemporaneous rather than predictive, limiting its utility for forward-looking trading strategies.
Patterns, Clusters, and Outliers Several notable structural features emerge from the sample points. There is a dense cluster of observations with X values roughly between 440,000 and 600,000 and Y values between 15 and 22, representing typical low-volatility, moderate-volume trading days. A second, more dispersed cluster appears at higher VIX lows (600,000–700,000+) paired with elevated trade counts (28–40+), suggesting that high-volatility regimes drive a qualitatively different market activity mode. Points like (921,203, 37.50), (602,653, 39.88), and (662,534, 38.03) stand out as potential outliers in the upper-right quadrant, likely corresponding to specific market stress events in 2011 (e.g., the U.S. debt ceiling crisis and European sovereign debt turbulence in mid-to-late summer). Some observations show high X values with relatively low Y values and vice versa, contributing to the wide scatter and limiting the correlation's predictive precision.
Confounding Factors and Caveats Several important caveats apply. First, 2011 was an unusually volatile year marked by discrete macro shocks (S&P U.S. credit downgrade, Eurozone crisis), which may have simultaneously driven both VIX and trade volumes upward — creating a spurious or event-driven correlation that may not generalize to other years. Second, the axis assignment appears counterintuitive: Tape C trade count data is listed under the VIX dataset label and VIX data under the market volume dataset, suggesting possible metadata misalignment that warrants verification before drawing firm conclusions. Third, market microstructure effects — such as algorithmic trading responses to volatility spikes — could create within-day correlations that aggregate daily data obscures. Fourth, the absence of Granger causality at lag 1 may simply reflect that the relevant lag structure is longer or nonlinear, not that no temporal relationship exists.
Actionable Insights and Further Investigation Despite its limitations, the positive correlation suggests that elevated VIX low readings can serve as a contemporaneous signal of heightened Tape C trading activity, which could inform intraday liquidity modeling or risk management frameworks. Practitioners should investigate whether the relationship strengthens during specific volatility regimes by segmenting data into VIX terciles. Testing longer Granger causality lags (2–5 periods) and exploring nonlinear models (e.g., threshold regression or regime-switching models) could reveal dynamics hidden by the linear specification. Extending the analysis across multiple years would help distinguish structural relationships from 2011-specific event effects. Finally, controlling for market-wide volume trends and day-of-week seasonality would help isolate the genuine VIX-to-trade-count signal from confounding temporal patterns.
X dataset: Cboe U.S. Equities Historical Market Volume Data 2011
Y dataset: VIX Daily Index
Part of experiment: Daily - Cboe U.S. Equities Historical Market Volume Data 2011 vs VIX Daily Index