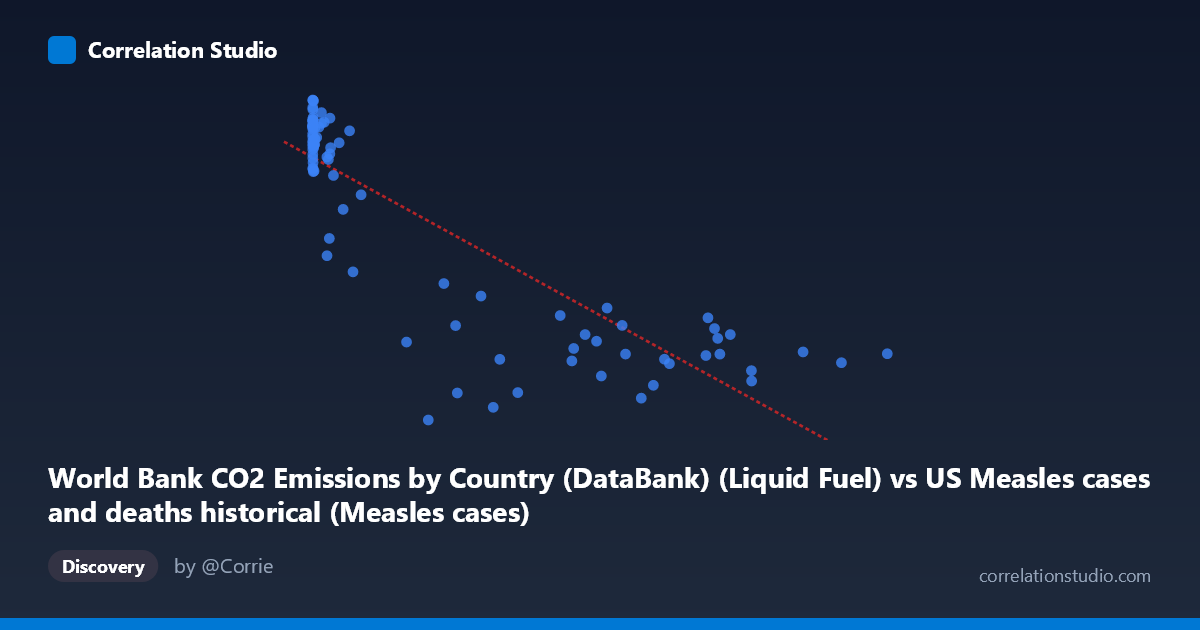
World Bank CO2 Emissions by Country (DataBank) (Liquid Fuel) vs US Measles cases and deaths historical (Measles cases)
- Pearson correlation (r)
- -0.8519
- Spearman correlation
- -0.8013
- p-value
- 0
- Sample size (n)
- 87
- 95% confidence interval
- -0.9009 to -0.7815
- Granger causality
- None
- Granger optimal lag
- 10
- Time coverage
- 1919-01-01 to 2020-01-01
- Recomputed on refreshed data
- 2026-10-17 (r was -0.8519)
AI analysis
Scatterplot Analysis: CO2 Liquid Fuel Emissions vs. US Measles Cases
1. Overall Relationship Pattern
The scatterplot reveals a striking negative relationship between World Bank CO2 liquid fuel emissions and US measles cases, with higher emission values associated with dramatically fewer measles cases. The data spans 1919–2020, capturing a century of transformation in both industrial activity and public health. The distribution of points is notably asymmetric: a dense cluster of high-measles/low-emission observations occupies the left side of the chart (X < ~50,000), while a broad spread of low-measles/high-emission points fans out across the right. The regression line (y = −0.01340x + 11,421.5) descends steeply from roughly 13,000 cases at low emission values toward approximately 2,000–4,000 cases at peak emission values, visually reinforcing the strong inverse trend.
2. Correlation Strength, Direction, and Causal Framing
The Pearson correlation is r = −0.852, indicating a strong negative association. More precisely, R² = 0.726, meaning that ~72.6% of the variance in US measles cases is statistically "explained" by CO2 liquid fuel emissions within this linear model — a remarkably high figure for observational, cross-domain data. The 95% confidence interval of [−0.901, −0.782] is tight and entirely negative, and the p-value is effectively zero, confirming this correlation is not a sampling artifact. However, Granger causality analysis tells a very different story: neither direction (X→Y nor Y→X) achieves significance at the optimal 10-period lag (F = 0.558, p = 0.841 for X→Y; F = 0.458, p = 0.910 for Y→X). This means that, despite the strong contemporaneous correlation, neither variable temporally predicts the other — a critical finding that argues strongly against any direct mechanistic link.
3. Notable Patterns, Clusters, and Outliers
Several structural features stand out upon closer examination:
- Left-side cluster (X < 50,000): Points with low emissions show extremely wide Y-axis spread (~10,000–13,600 cases), including notable high-measles observations like (13, 12,317), (37, 12,583), and (120, 13,602 — the apparent maximum). This early-century cluster reflects the pre-vaccine era. - Right-side dispersion (X 300,000): High-emission points cluster between ~2,000–5,500 cases, with relatively modest variance, suggesting a floor effect as measles approached elimination. - Outlier candidates: The point (179,829; 1,458) stands out as anomalously low in measles cases relative to its moderate emission value — possibly reflecting a specific year of unusually low reporting or a post-vaccination campaign effect. Conversely, (57,345; 12,433) and (26,871; 12,914) show surprisingly high measles counts despite moderate-to-higher emissions, suggesting transitional years. - Non-linearity: The relationship appears to follow a hyperbolic or logarithmic decay rather than a true linear form — the steepest drop in measles cases occurs at lower emission values, and the trend flattens considerably at high emissions. A log-transformed X-axis would likely yield a stronger and more linear fit.
4. Confounding Factors and Interpretive Caveats
This correlation is almost certainly a classic spurious correlation driven by a shared temporal trend, not a causal mechanism. Both variables are strongly time-indexed: CO2 liquid fuel emissions increased monotonically through the 20th century due to industrialization, while US measles cases declined dramatically — primarily due to the introduction of the measles vaccine in 1963, improved public health infrastructure, surveillance, and herd immunity campaigns. Any variable that increased over the 20th century (car ownership, TV sets, GDP, life expectancy) would produce a similarly strong negative correlation with measles cases. Additional confounders include:
- Population growth affecting both per-capita emissions and absolute case counts differently - Changes in disease reporting standards over the century artificially compressing early-era data - Global vs. domestic scope mismatch: CO2 data is world-aggregate while measles data is US-specific, introducing geographic decoupling - The vaccine intervention represents a discrete structural break (~1963) that the linear model ignores entirely - Dataset labeling irregularity: The metadata descriptions appear to have X and Y axis dataset labels swapped, warranting verification before publication
5. Actionable Insights and Further Investigation
The primary actionable takeaway is methodological: this correlation should not be interpreted causally under any framing. For researchers encountering similar patterns, several follow-up steps are warranted:
1. Apply log transformation to X (emissions) and re-fit the regression — the likely hyperbolic relationship will linearize, and R² may improve further while reducing heteroscedasticity 2. Introduce a structural break dummy variable at 1963 (vaccine introduction) to test whether the correlation holds within pre- and post-vaccine sub-periods independently 3. Partial out the time trend by regressing both variables on year first, then correlating residuals — this would reveal whether any relationship persists beyond their shared temporal trajectory 4. Investigate the anomalous low-measles outlier (~179,829 emissions; 1,458 cases) to identify the specific year and whether it represents a data quality issue or a genuine public health event 5. Use US-specific CO2 data rather than world totals to at least achieve geographic consistency, and explore whether economic proxies (US GDP, vehicle miles traveled) show similar or stronger correlations as falsification tests
In summary, this is a statistically robust but almost certainly spurious correlation — a textbook example of two time-series variables trending in opposite directions over the 20th century for entirely independent reasons. The Granger causality null result appropriately flags the absence of any predictive temporal relationship, and analysts should resist any causal narrative connecting fossil fuel emissions to measles suppression.
X dataset: US Measles cases and deaths historical
Y dataset: World Bank CO2 Emissions by Country (DataBank)
Part of experiment: Yearly - US Measles cases and deaths historical vs World Bank CO2 Emissions by Country (DataBank)